Why the Crypto Market Is up Today

The Total Crypto Market Cap (TOTALCAP) broke out from a horizontal resistance area, while both the Bitcoin (BTC) and Solana (SOL) prices broke out from descending resistance lines.
On Jan. 3, Sam Bankman-Fried pleaded not guilty to defrauding investors of his now-bankrupt crypto exchange FTX. He was successful in requesting that the two individuals who signed his bond remain anonymous.
In other news, crypto Twitter is concocting a plan to acquire the IP of FTX and relaunch it as a new exchange.
TOTALCAP Creates Bullish Pattern
The crypto market cap created a double bottom pattern (green icons) inside the $752 billion support area between Dec. 18 and 30. The double bottom is considered a bullish pattern, meaning that it leads to upward movements most of the time.
Furthermore, the pattern was combined with bullish divergence in the six-hour RSI (green line), another sign associated with a bullish reversal.
Unsurprisingly, the cryptocurrency market cap began to increase after the second bottom. On Jan. 3, the crypto market cap broke out from the $770 billion resistance area. Now, the next resistance is at $810 billion.
As long as TOTALCAP does not close below $770 billion, an upward movement toward $810 billion is the most likely scenario.
A close below $770 billion would likely lead to a drop toward $750 billion.
Bitcoin Makes Breakout Attempt
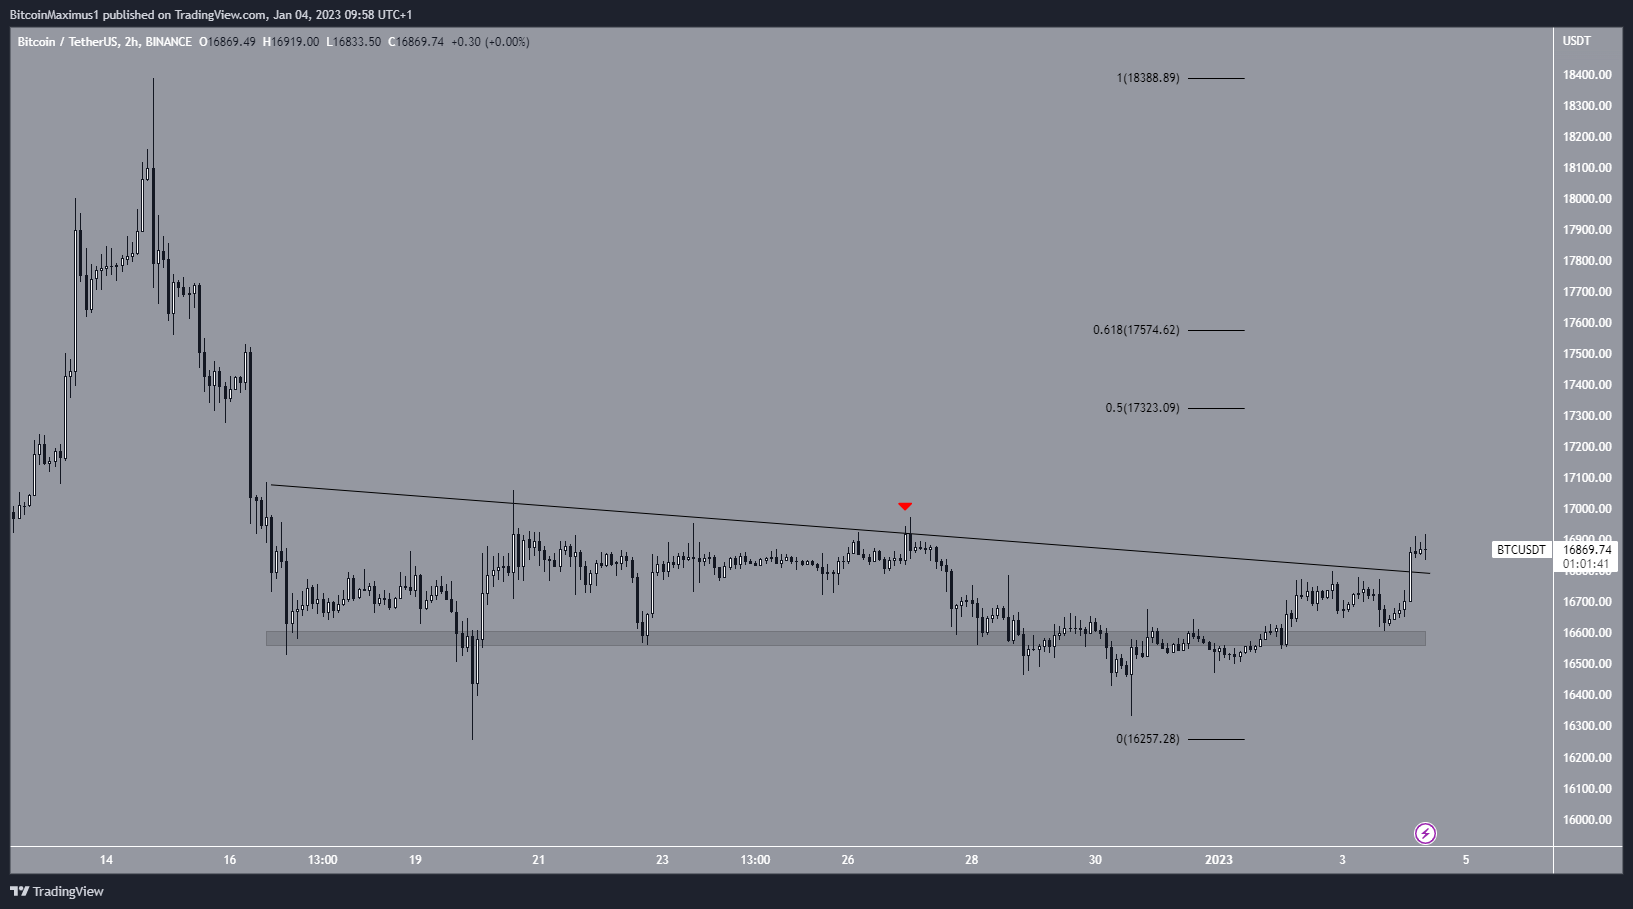
The Bitcoin price has decreased below a descending resistance line since Dec.16. The line caused numerous rejections, most recently on Dec. 27. However, the BTC price was finally successful in breaking out on Jan. 3.
If the upward movement continues, the closest resistance levels would be between $17,325 and $17,575, created by the 0.5-0.618 Fib retracement resistance levels.
On the other hand, a return below the descending resistance line would likely lead to a fall toward the $16,590 support area and potentially a breakdown below $16,500.

SOL Reaches Resistance After 47% Increase
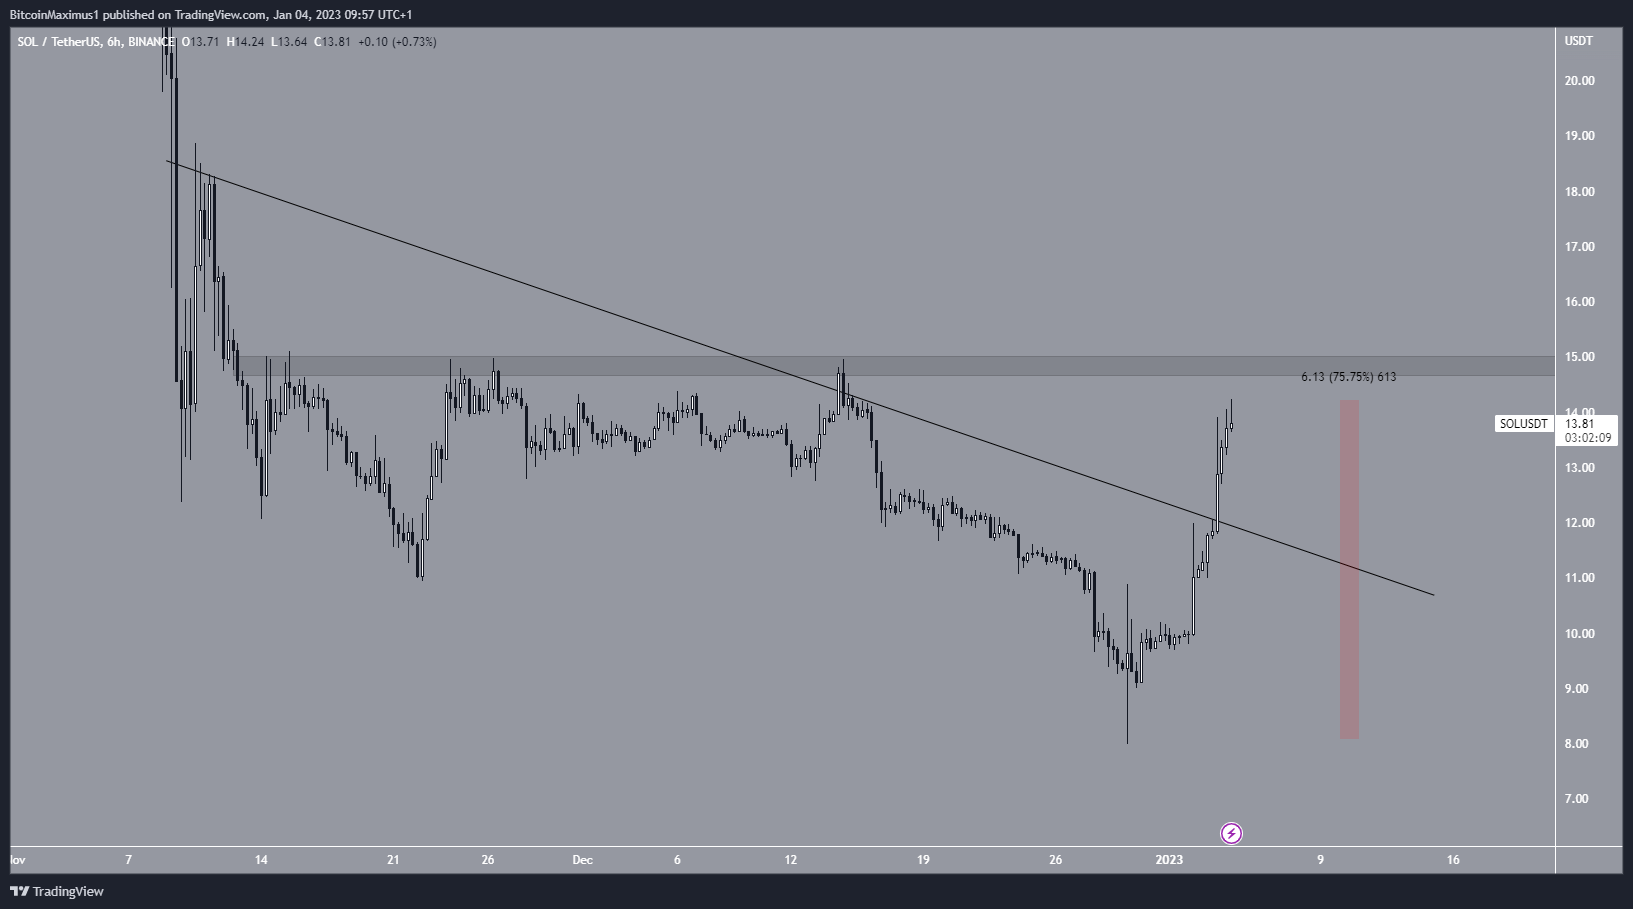
The SOL price has fallen below a descending resistance line since Nov. 9. The decrease led to a low of $8 on Dec. 29. Shortly afterward, the Solana price created a long lower wick (green icon) and began an upward movement. The SOL price broke out from the line on Jan. 3. Measuring from its Dec. 29 lows, the SOL price has increased by 75%.
SOL has nearly reached the $14.80 resistance area. A breakout above it could lead to the acceleration of the upward movement.
On the other hand, a rejection from it could lead to a re-test of the descending resistance line.

For BeInCrypto’s latest crypto market analysis, click here.
Disclaimer
BeInCrypto strives to provide accurate and up-to-date information, but it will not be responsible for any missing facts or inaccurate information. You comply and understand that you should use any of this information at your own risk. Cryptocurrencies are highly volatile financial assets, so research and make your own financial decisions.


