Solana, Fantom Recover From Dip to New All-Time Highs

Key Takeaways
More than $300 billion was wiped out of the entire cryptocurrency market cap during Tuesday’s crash.
Solana and Fantom managed to weather the storm and rebound strongly.
Both cryptocurrencies have made new all-time highs, luring investors into long positions.
Share this article
Solana and Fantom have quickly recovered from the market’s recent flash crash. Both assets now sit at crucial support levels that could propel them into higher highs.
Layer 1 Coins Post V-Shaped Recovery
Solana and Fantom are among the altcoins that have gained pace since the cryptocurrency market experienced one of its steepest flash crashes of the year.
Although more than $3.5 billion in liquidations were generated across the board after the market dipped Tuesday, some investors appear to have taken advantage of the correction to buy tokens at a discount. Behavior analytics platform Santiment has pointed out that mentions of “buy” and “dip” together have skyrocketed, suggesting a bullish bias among retail investors.
The significant increase in buying pressure has allowed several digital assets to recover to new all-time highs.
Both of the Layer 1 projects have surged by more than 30% in the last 24 hours, registering a V-shaped recovery. SOL was able to reach a new milestone at $216, while FTM recorded a new all-time high of $1.94.
Further buying pressure could see both digital assets make higher highs.
Solana in Price Discovery Mode
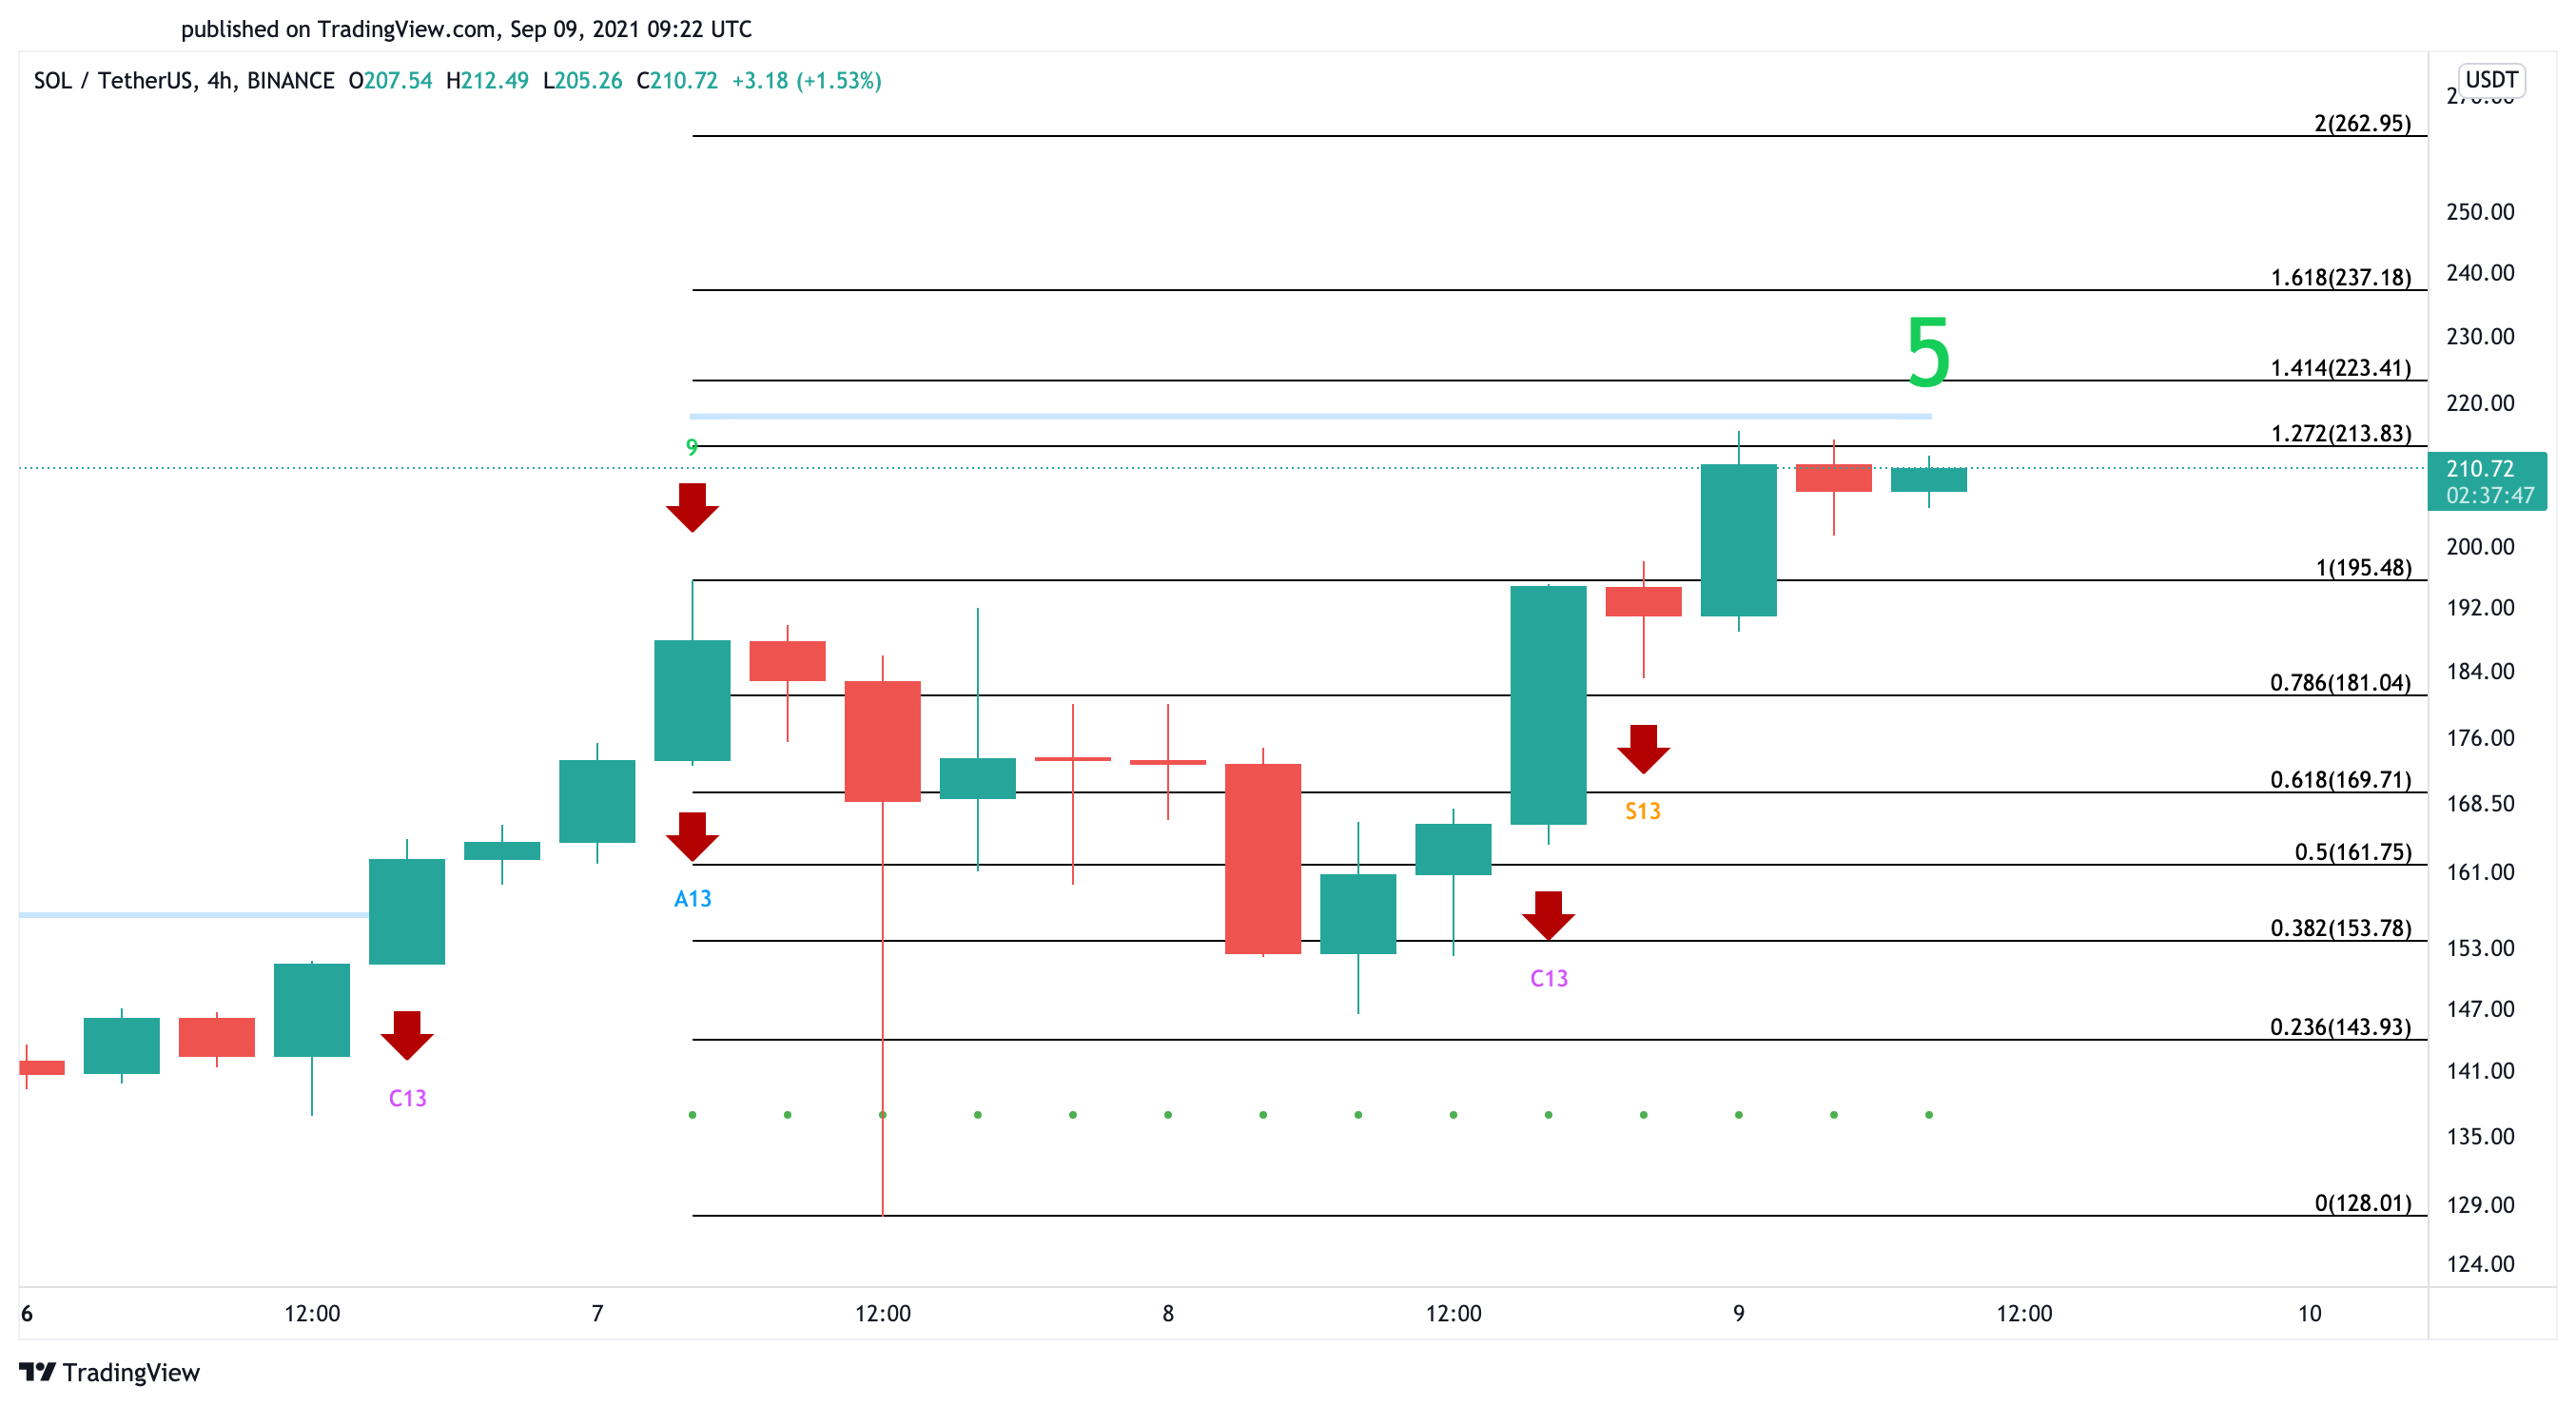
The four-hour chart suggests that Solana is trying to overcome a psychological resistance level that lies between $213 and $218.
Given the significant gains that this cryptocurrency has posted over the last few months, it seems that investors remain cautious about a potential spike in profit-taking. Only a four-hour candlestick close above this barrier would signal the continuation of the uptrend.
By slicing through the $213 to $218 region, Solana might attract a new wave of buyers that push prices further up. Based on the Fibonacci retracement indicator, SOL could target $237 or even $263 upon the break of the overhead resistance.

It is imperative to watch out for the $195 demand wall, as any downswing below this price point would indicate an incoming bearish impulse. If Solana loses this underlying support level, a steeper decline towards $170 to $160 could be imminent.
Fantom Lures Investors
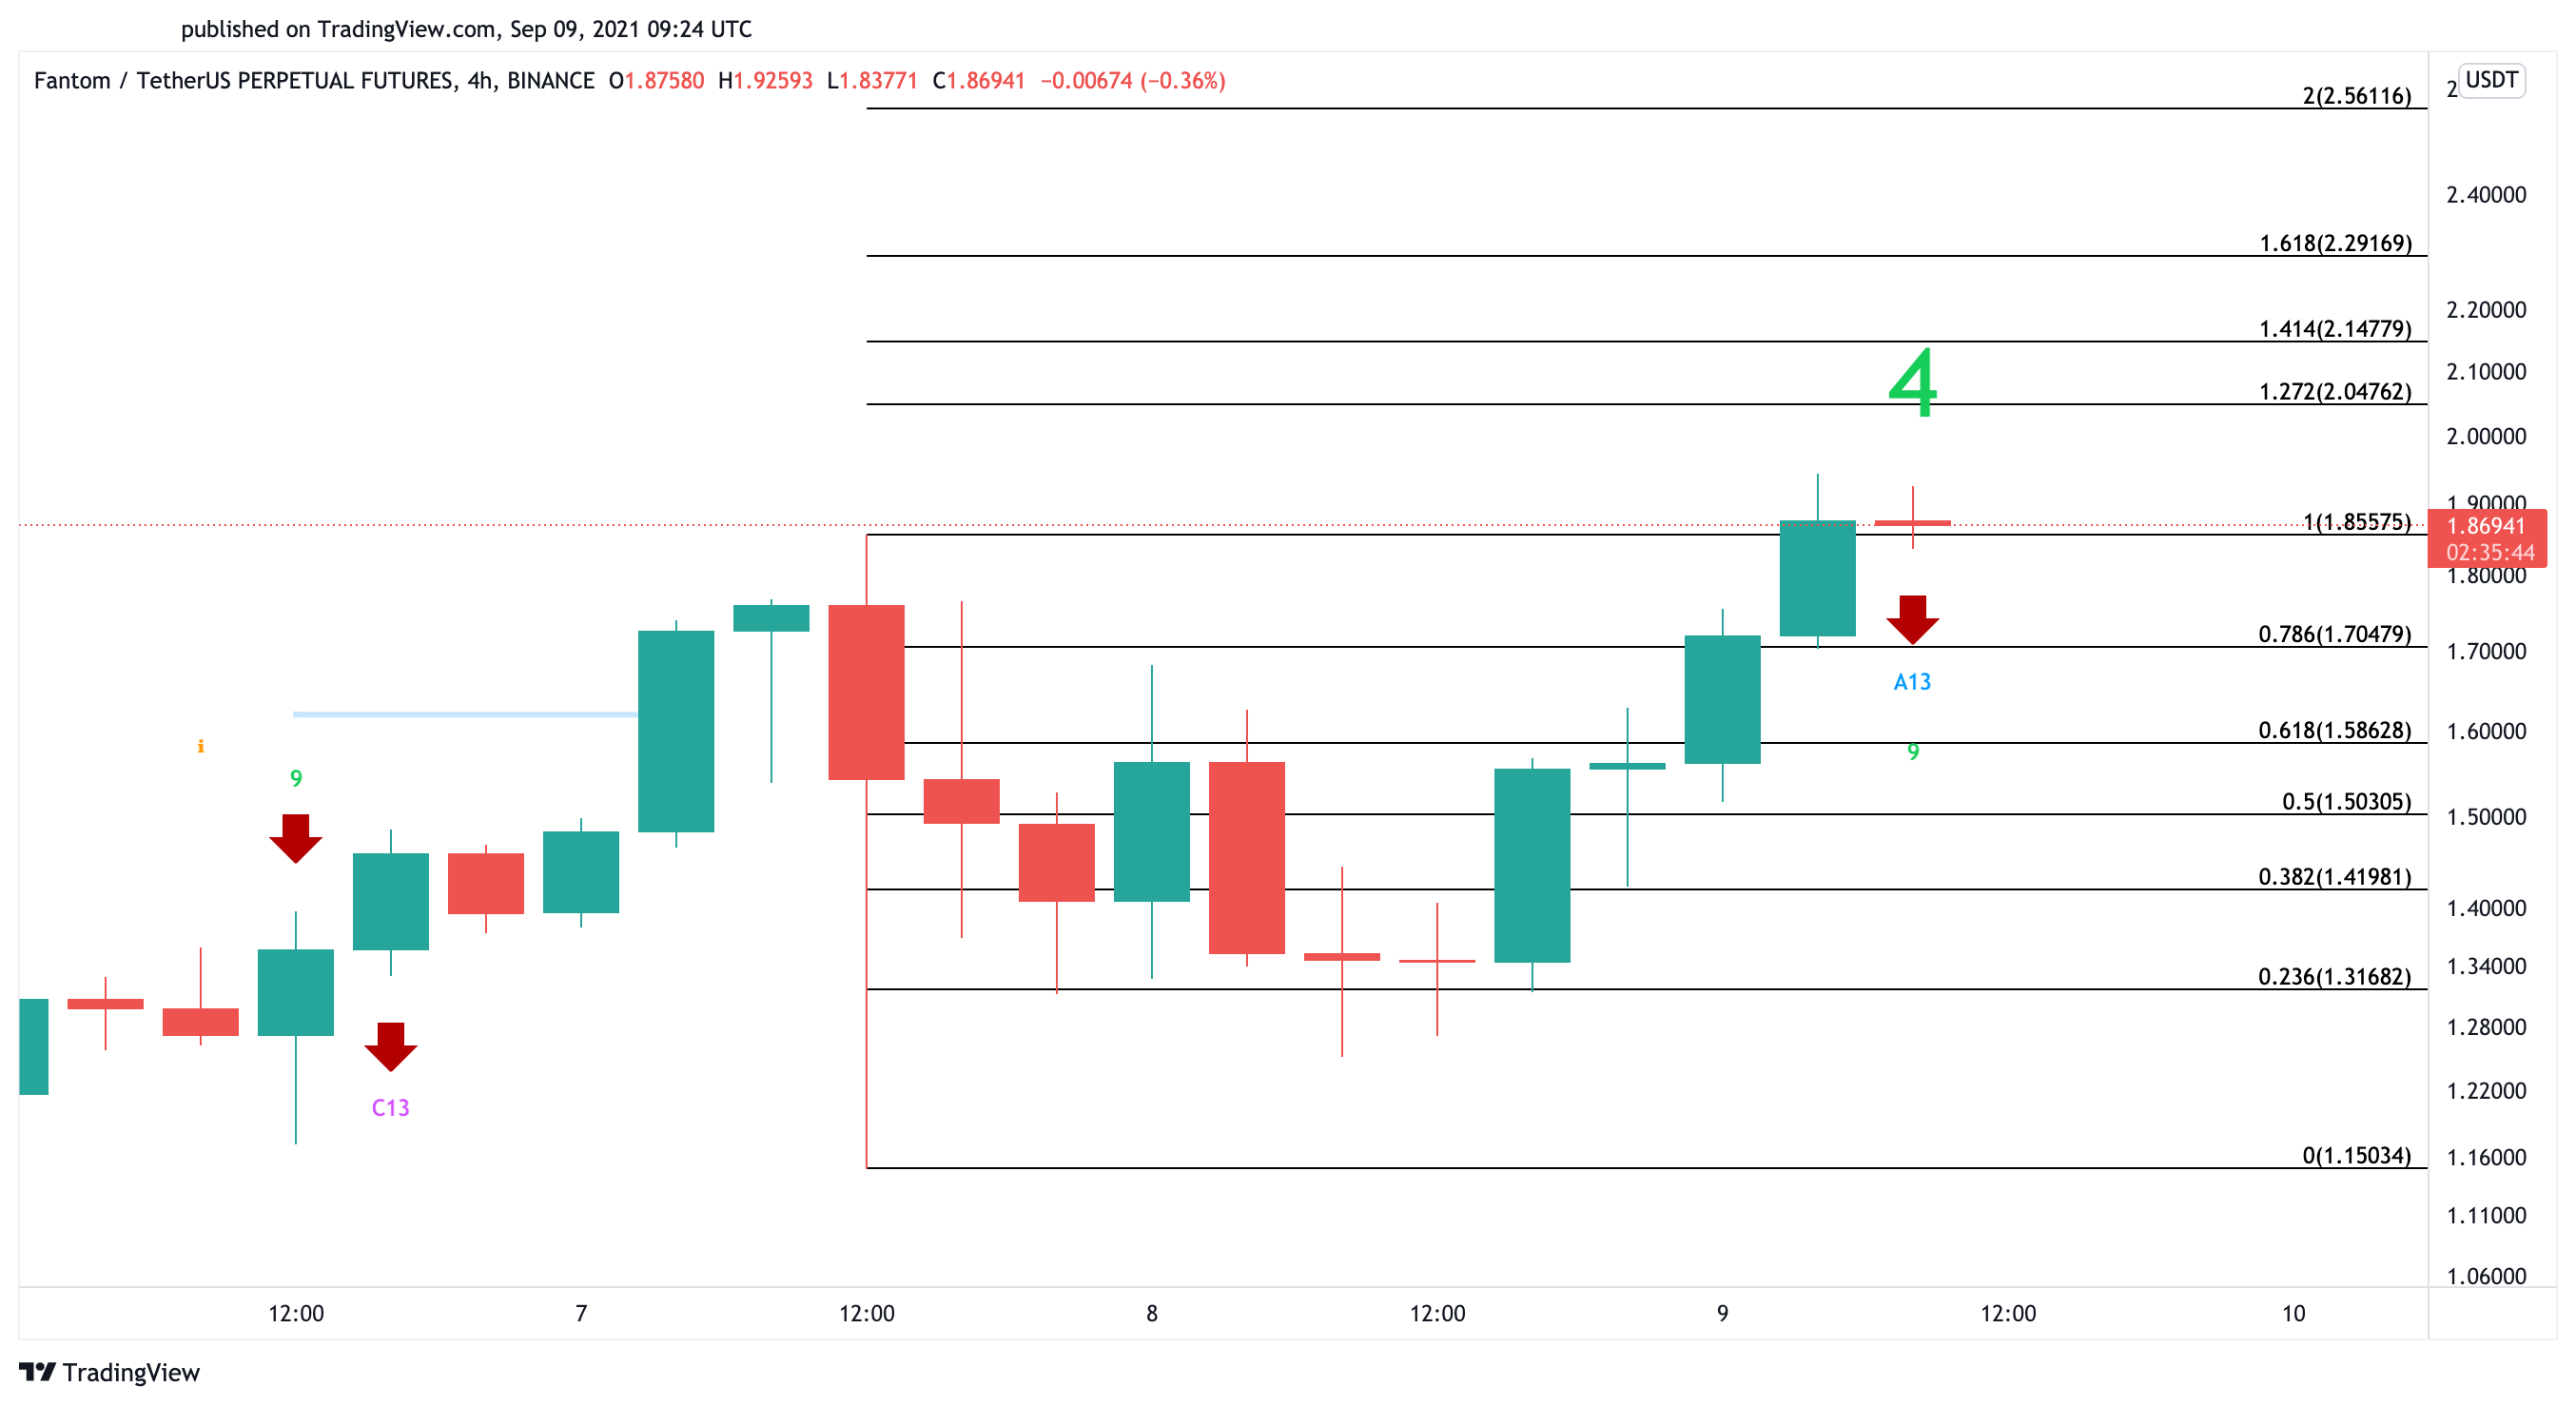
Fantom bounced strongly off the $1.15 support level after taking a 38% nosedive. The bullish impulse was significant enough to push FTM to a new all-time high of $1.94. Now, the Tom DeMark (TD) Sequential indicator has presented a warning signal to investors looking to buy in.
The TD setup flashed an aggressive 13 candlestick on the four-hour chart, which can be considered a sell signal. A spike in selling pressure could push Fantom toward the 61.8% or 50% Fibonacci retracement level. These support levels sit at $1.58 and $1.50 respectively.

Regardless of the bearish formations, the $1.86 level would play a vital role in Fantom’s uptrend. A four-hour candlestick close about this price point could mark FTM’s entry into price discovery mode. Under such unique circumstances, investors should prepare for an upswing to $2.30 or even $2.56.
Share this article
The information on or accessed through this website is obtained from independent sources we believe to be accurate and reliable, but Decentral Media, Inc. makes no representation or warranty as to the timeliness, completeness, or accuracy of any information on or accessed through this website. Decentral Media, Inc. is not an investment advisor. We do not give personalized investment advice or other financial advice. The information on this website is subject to change without notice. Some or all of the information on this website may become outdated, or it may be or become incomplete or inaccurate. We may, but are not obligated to, update any outdated, incomplete, or inaccurate information.
You should never make an investment decision on an ICO, IEO, or other investment based on the information on this website, and you should never interpret or otherwise rely on any of the information on this website as investment advice. We strongly recommend that you consult a licensed investment advisor or other qualified financial professional if you are seeking investment advice on an ICO, IEO, or other investment. We do not accept compensation in any form for analyzing or reporting on any ICO, IEO, cryptocurrency, currency, tokenized sales, securities, or commodities.
See full terms and conditions.
Solana Makes New All-Time High As Sell Signal Pops Up
Solana appears to be approaching exhaustion. A Wall Street-class trading indicator shows a one to four daily candlestick correction may occur before SOL advances further. Solana Flashes Sell Signal Solana…
What is Impermanent Loss and How can you avoid it?
DeFi has given traders and investors new opportunities to earn on their crypto holdings. One of these ways is by providing liquidity to the Automated Market Makers (AMMs). Instead of holding assets,…
Solana Integrates Chainlink to Offer Crypto Price Feeds
Solana announced today that it has integrated Chainlink with its platform, allowing developers to utilize decentralized price feeds. Solana Devnet Adds Chainlink Chainlink is an oracle service that provides price…
Fantom Surges 27% Amid On-Chain D&D Hype
An on-chain Dungeons and Dragons-inspired game called Rarity has exploded in popularity this week. Since the game’s launch, the FTM token has reached new all-time highs. Fantom Hosts Text File…


