Q3 NFT Report Shows Non-Fungible Token Markets ‘Are in Phase of Dynamic, Unstoppable Growth’ – Blockchain Bitcoin News
Non-fungible token (NFT) assets have seen significant demand since the beginning of 2021 and third quarter statistics show that key indicators have continued to rise. Just recently nonfungible.com published its Q3 2021 NFT Quarterly Report which shows active wallets increased, the number of NFT buyers has risen, and the number of sellers has grown faster than the amount of buyers.
NFT Action Spikes Higher in Q3
NFT market action in Q3 2021 broke previous recorded quarterly metrics as NFT demand continues into the last few months of the year. The web portal nonfungible.com’s researchers published a study that covers 2021’s third quarter and data shows that most indicators are growing. For instance, active wallets, the number of wallets that have interacted with an NFT smart contract, increased 102.52% from 203,719 active wallets in Q2 to 412,578 in Q3.
NFT buyers increased by 166.73% from 97,658 in Q2 to 260,489 in the third quarter. Sellers jumped from 40,056 to 122,910 and saw a much larger 206.84% increase during the last quarter. The amount of U.S. dollars exchanged for NFTs in Q2 was $782 million but in Q3 it rose a great deal to $5.9 billion.
“During the volume of USD traded all-time high at the end of August, we saw another all-time high in terms of active wallets,” nonfungible.com’s Q3 report notes. “The Weekly Volume which was already almost $91M per week climbed to $1.674B within 2 months.” Nonfungible.com’s researchers add:
After this peak, we notice that the weekly volume stabilizes at a level almost 3 times higher than its previous level, at around $300M per week.
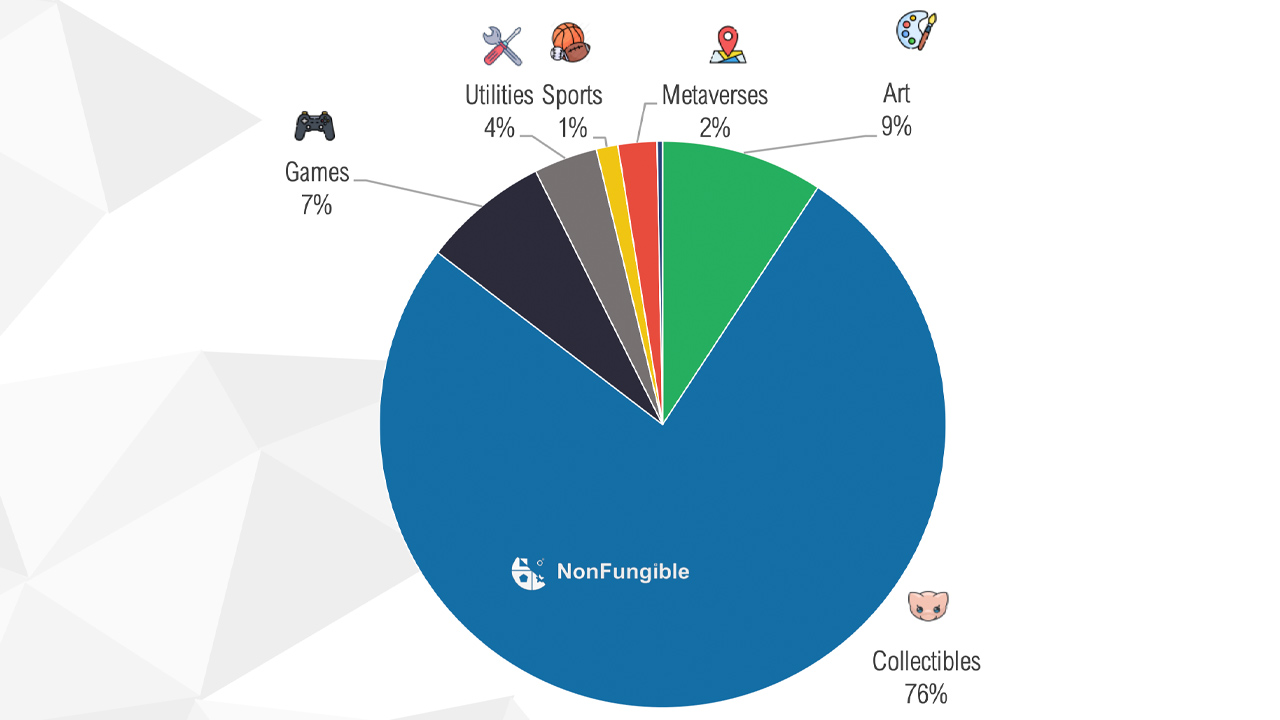
In terms of loyalty, NFT patrons like metaverse NFTs are the most loyal and this is followed by NFT collectibles. Sports, games, art, and utility NFTs follow collectibles as far as NFT loyalty is concerned. Collectibles saw the most sales capturing 76% of sales while 9% of sales were focused on art NFTs. Sports would be the least sold NFTs with only 1% of the sales in the third quarter.
Q3 Report Indicates That the ‘NFT Market Is Evolving Fast and at an Exponential Rate’
The biggest collectible NFT projects include Cryptopunks and Bored Ape Yacht Club (BAYC). In terms of collectible NFTs “the primary market share has more than doubled, to represent 75% of the entire collectibles market,” the study’s researchers detail. “This extremely high rate reflects the relative saturation of this segment: too many assets issued for too little resale, or at lower prices.”
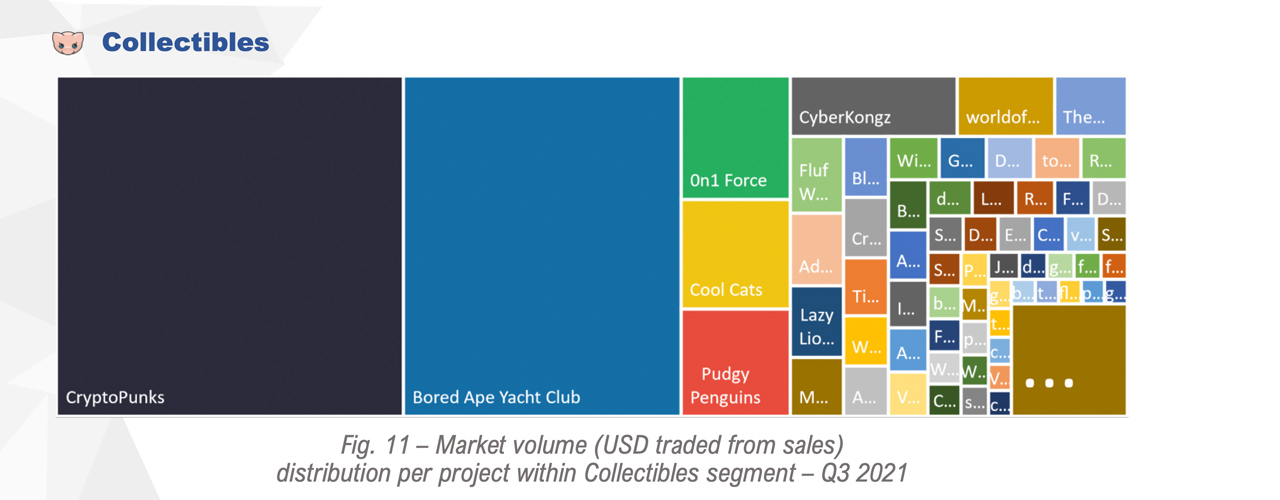
The researcher’s report concludes that the market is evolving fast and at “an exponential rate.” The liquidity has been unprecedented but also “more of a speculative and volatile market than ever before,” the Q3 NFT report explains. “The recent growth of the NFT industry has been almost unbelievable, in just a few short months, the billion-dollar mark was crossed in traded NFTs, followed by billion per quarter and only then to be surpassed by billion per month,” nonfungible.com’s study reveals. The researchers further conclude:
If we are to believe the current figures, the market is in a phase of dynamic and unstoppable growth, with no shadows hiding in the corners. However, the reality is a little different and we would like to be clear that indicators such as the traded volume in USD or the number of trades are not the best metrics by which to monitor the market as they only reveal the very tip of the iceberg.
What do you think about the non-fungible token (NFT) asset action in the third quarter? Let us know what you think about this subject in the comments section below.
Image Credits: Shutterstock, Pixabay, Wiki Commons, nonfungible.com
Disclaimer: This article is for informational purposes only. It is not a direct offer or solicitation of an offer to buy or sell, or a recommendation or endorsement of any products, services, or companies. Bitcoin.com does not provide investment, tax, legal, or accounting advice. Neither the company nor the author is responsible, directly or indirectly, for any damage or loss caused or alleged to be caused by or in connection with the use of or reliance on any content, goods or services mentioned in this article.


