January 2023 Top 5 Altcoins to Watch

Top 5 Altcoins to Watch in January 2023: The Coti (COTI) hard fork went live on Dec. 29, while the Flare airdrop will finally go live on Jan. 9. The Chiliz (CHZ) mainnet will launch in the first quarter of 2023.
Ergo (ERG) continues to reduce its emissions while the Ethereum (ETH) annual inflation since the merge is at 0.014%, a considerable decrease from its 3.57% pre-merge inflation.
Chiliz (CHZ) Leads Altcoins To Watch
Price: $0.10
Market Cap: $636,517 million
Rank: #52
Chiliz is a digital currency used in the sports and entertainment industry. It is the native token of the Socios platform, home to various Football national team fan tokens. While the CHZ price was expected to increase during the 2022 FIFA World Cup, it failed to do so and actually decreased considerably.
Nevertheless, there is positive upcoming Chiliz news. The Chiliz mainnet 2.0 will launch on Dec. 31 or early Q1 2023. This follows phase 5 of testnet, which was released at the end of November and introduced staking and governance on the Scoville testnet. Chiliz 2.0 will be the successor of the Chiliz chain, a self-sovereign blockchain that is compatible with the Ethereum Virtual Machine (EVM). CHZ will still be the native token of Chiliz Chain 2.0, and will be used to pay gas/invoke smart contracts, perform cross-chain operations, and secure the network.
The CHZ price has fallen since breaking down from an ascending support line on Dec. 8 (red icon). Shortly afterward, the downward movement caused a breakdown from the $0.135 horizontal support area. This led to a low of $0.101 on Dec. 2021.
If the downward movement continues, the next closest support area would be at $0.090. While there are no bullish reversal signs in place yet, the daily RSI is very close to an all-time low (white line). As a result, a significant bounce may follow once the CHZ price falls to the $0.090 support area.
Reclaiming the $0.135 area would mean that the trend is bullish, while a close below $0.090 would indicate that the trend is bearish instead.
Ethereum Supply Nearly Becomes Deflationary
Price: $1,200
Market Cap: $146,900 billion
Rank: 2
Ethereum is the second largest cryptocurrency based on its market cap, trailing only Bitcoin. Therefore, it is the largest altcoin. While no imminent news is coming up in January 2023, the supply dynamics since the launch of ETH 2.0 are impressive.
In the 105 days since the ETH merge, the total ETH supply has increased by only 4,707 ETH, or a percentage increase of 0.0039%. This amounts to annual inflation of 0.014%. This pales in comparison to the 3.58% pre-merge inflation and the 1.71% inflation of BTC.
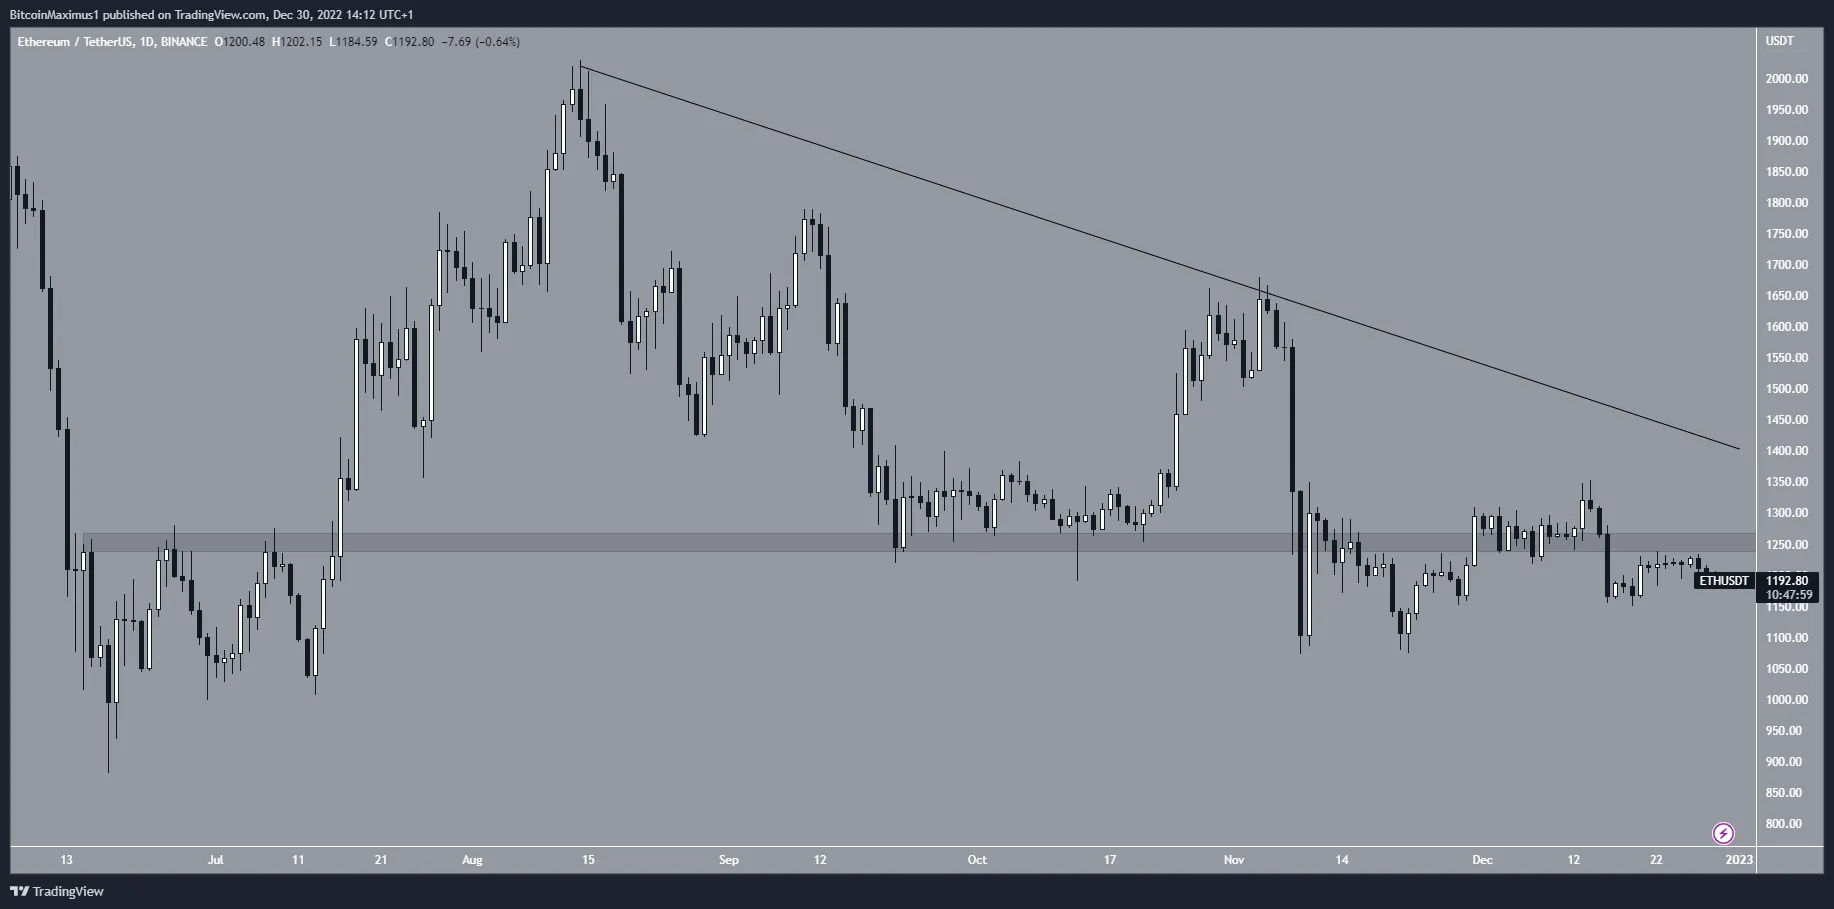
However, the ETH price movement is not bullish yet because the altcoin is trading below the $1,250 horizontal support area. This is a crucial area that has intermittently acted as both support and resistance since June.
As a result, the trend is considered bearish as long as the price is trading below it. A reclaim of the area and then the descending resistance line at $1,400 would be required for the trend to be decisively bullish.

COTI Fork Goes Live
Price: $0.058
Market Cap: $64.554 Million
Rank: #264
Coti is a financial technology platform that allows organizations to build their own payment systems and stablecoins. The platform supports interoperability between different blockchains. The native token for the platform is COTI.
The COTI Mainnet hard fork went live on Dec. 29. The launch represents the transition of COTI from a single currency infrastructure to a multi-token network. It will now be possible to issue tokens on top of the COTI trustchain, in a similar fashion to ERC20 tokens on the Ethereum blockchain. Additionally, the Bridge 2.0 wallet app was released simultaneously. The app will allow users to apply for a refund if a swap does not execute for technical reasons.
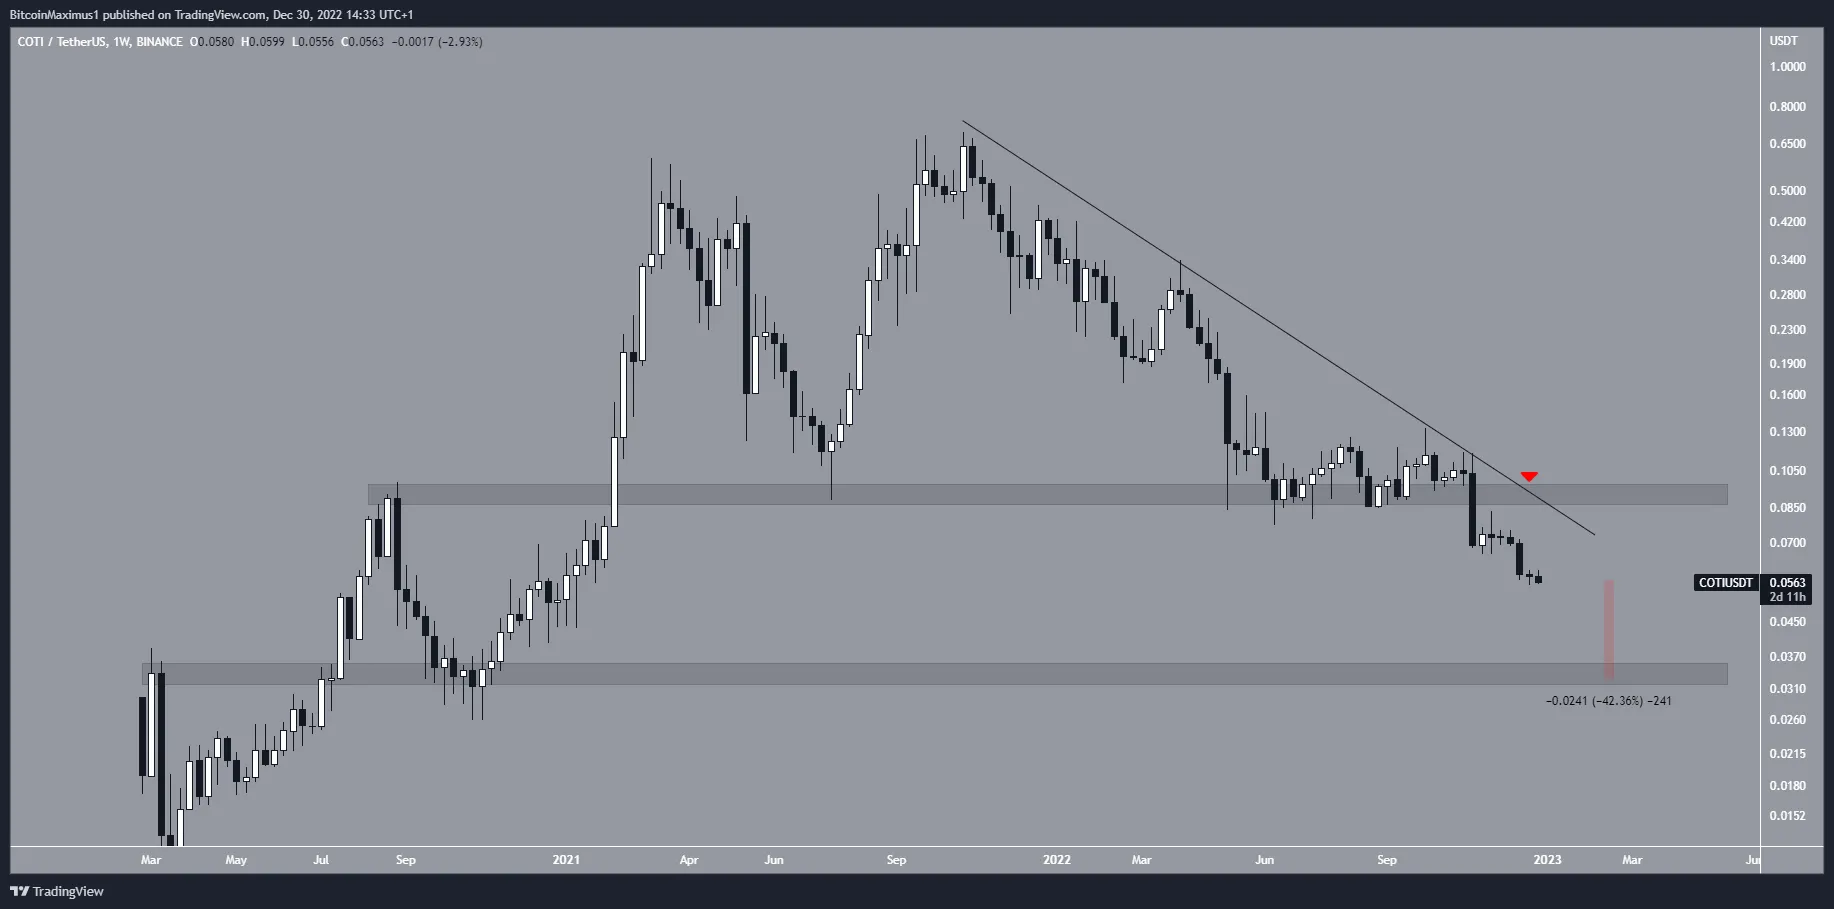
However, the COTI price action is still bearish. The COTI price broke down from the $0.095 area at the beginning of November and has decreased considerably since. Moreover, the next support area is at $0.034, a drop of 42% from the current price.
The COTI price has to break out from the current descending resistance line and the $0.095 resistance area for the trend to be bullish.

Flare is a New Exciting Altcoin
Flare is an exciting addition since it has not yet been released. Its snapshot on Dec. 12, 2020, received much hype. At the time, it was announced that users will be rewarded with one FLR token for each XRP token they hold. After more than two years, the airdrop will finally be released on Jan. 9, supported by numerous exchanges, including Binance.
Out of the total 100 Billion tokens, 58.3% will be given to the community. 15% of that will be released on Jan. 9, while the remainder will be gradually received over a period of 36 months.
Ergo (ERG) Reduces Emissions
Price: $1.21
Market cap: $71.419 million
Rank : #22
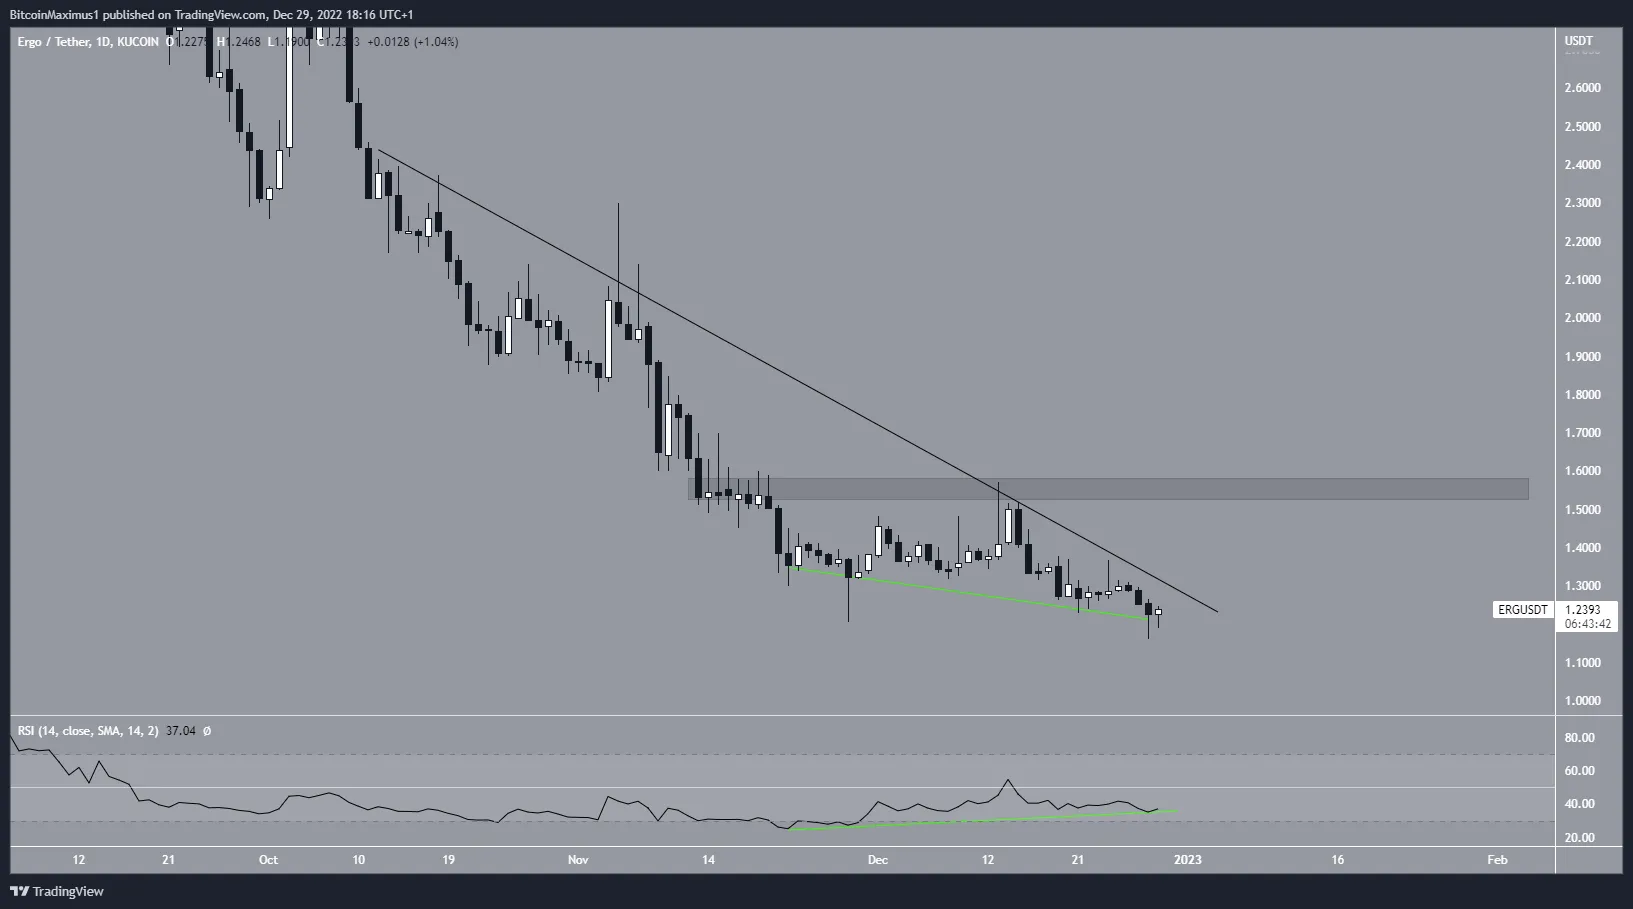
Ergo is a smart contract platform that aims to provide economic freedom to ordinary people through decentralized and accessible financial tools. Simply put, the Ergo platform delivers a simple way to implement financial contracts. On Jan. 9 at block height 1,200,000, the emissions per block will drop from 45 to 42. This is part of a gradually decreasing curve that will lead to block emissions of only 3 ERG at network height 1,760,000 The ERG price has been falling underneath a descending resistance line since Oct. 12 and is trading very close to an all-time low. However, there is also a massive bullish divergence that has developed in the daily RSI (green line). Such divergences often precede bullish trend reversals.
Moreover, the divergence is combined with a double bottom, considered a bullish pattern. This increases the potential for an eventual breakout.
If the ERG price manages to break above the descending resistance line, it could increase toward the $1.55 resistance area.
Conversely, another rejection would likely take the price below $1.

Disclaimer
BeInCrypto strives to provide accurate and up-to-date information, but it will not be responsible for any missing facts or inaccurate information. You comply and understand that you should use any of this information at your own risk. Cryptocurrencies are highly volatile financial assets, so research and make your own financial decisions.


