
Cardano (ADA) Price Drop – What’s the Next Move?

The Cardano (ADA) price has broken down from an important pattern in the daily time frame and risks falling below a crucial horizontal support level.
If that occurs, the ADA price will confirm that the trend is bearish. This will likely cause the acceleration of the ongoing decrease.
Cardano Price Bounces but Fails to Reclaim Resistance
The technical analysis on a daily timeframe provides a pessimistic forecast for the price of Cardano. This can be attributed to both the indicator readings and the price action.
Specifically, On April 20, the ADA token price dropped below a long-term ascending parallel channel that it had been trading in since March 10.

This pattern is regarded as bearish. It involves the price moving between two parallel resistance and support lines before an eventual breakdown. ADA later validated the channel as resistance on April 27 (red icon) before continuing its decline.
Furthermore, the daily Relative Strength Index (RSI) also gives a bearish reading below 50. Market traders use the RSI as a momentum indicator to identify overbought or oversold conditions, and to decide whether to accumulate or sell an asset.
Readings above 50 and an upward trend indicate that bulls still have an advantage, whereas readings below 50 suggest the opposite.
At the same time the price broke down from the channel, the indicator moved below 50. This confirmed the validity of the breakdown.
ADA Price Prediction: Is a Breakdown Imminent?
The price action from the short-term six-hour time frame shows that the ADA price has fallen under a descending resistance line since April 15. So, the trend is considered bearish until the price breaks out.
Currently, ADA is trading at a confluence of support levels at $0.36. The support is created by a horizontal support area and the 0.618 Fib retracement support level.
The principle behind Fibonacci retracement levels suggests that after a considerable price movement in one direction. The price will retrace or go back partially to a previous price level before continuing in its original direction.
The 0.618 Fib level is the most important and very often acts as the bottom during corrective movements.
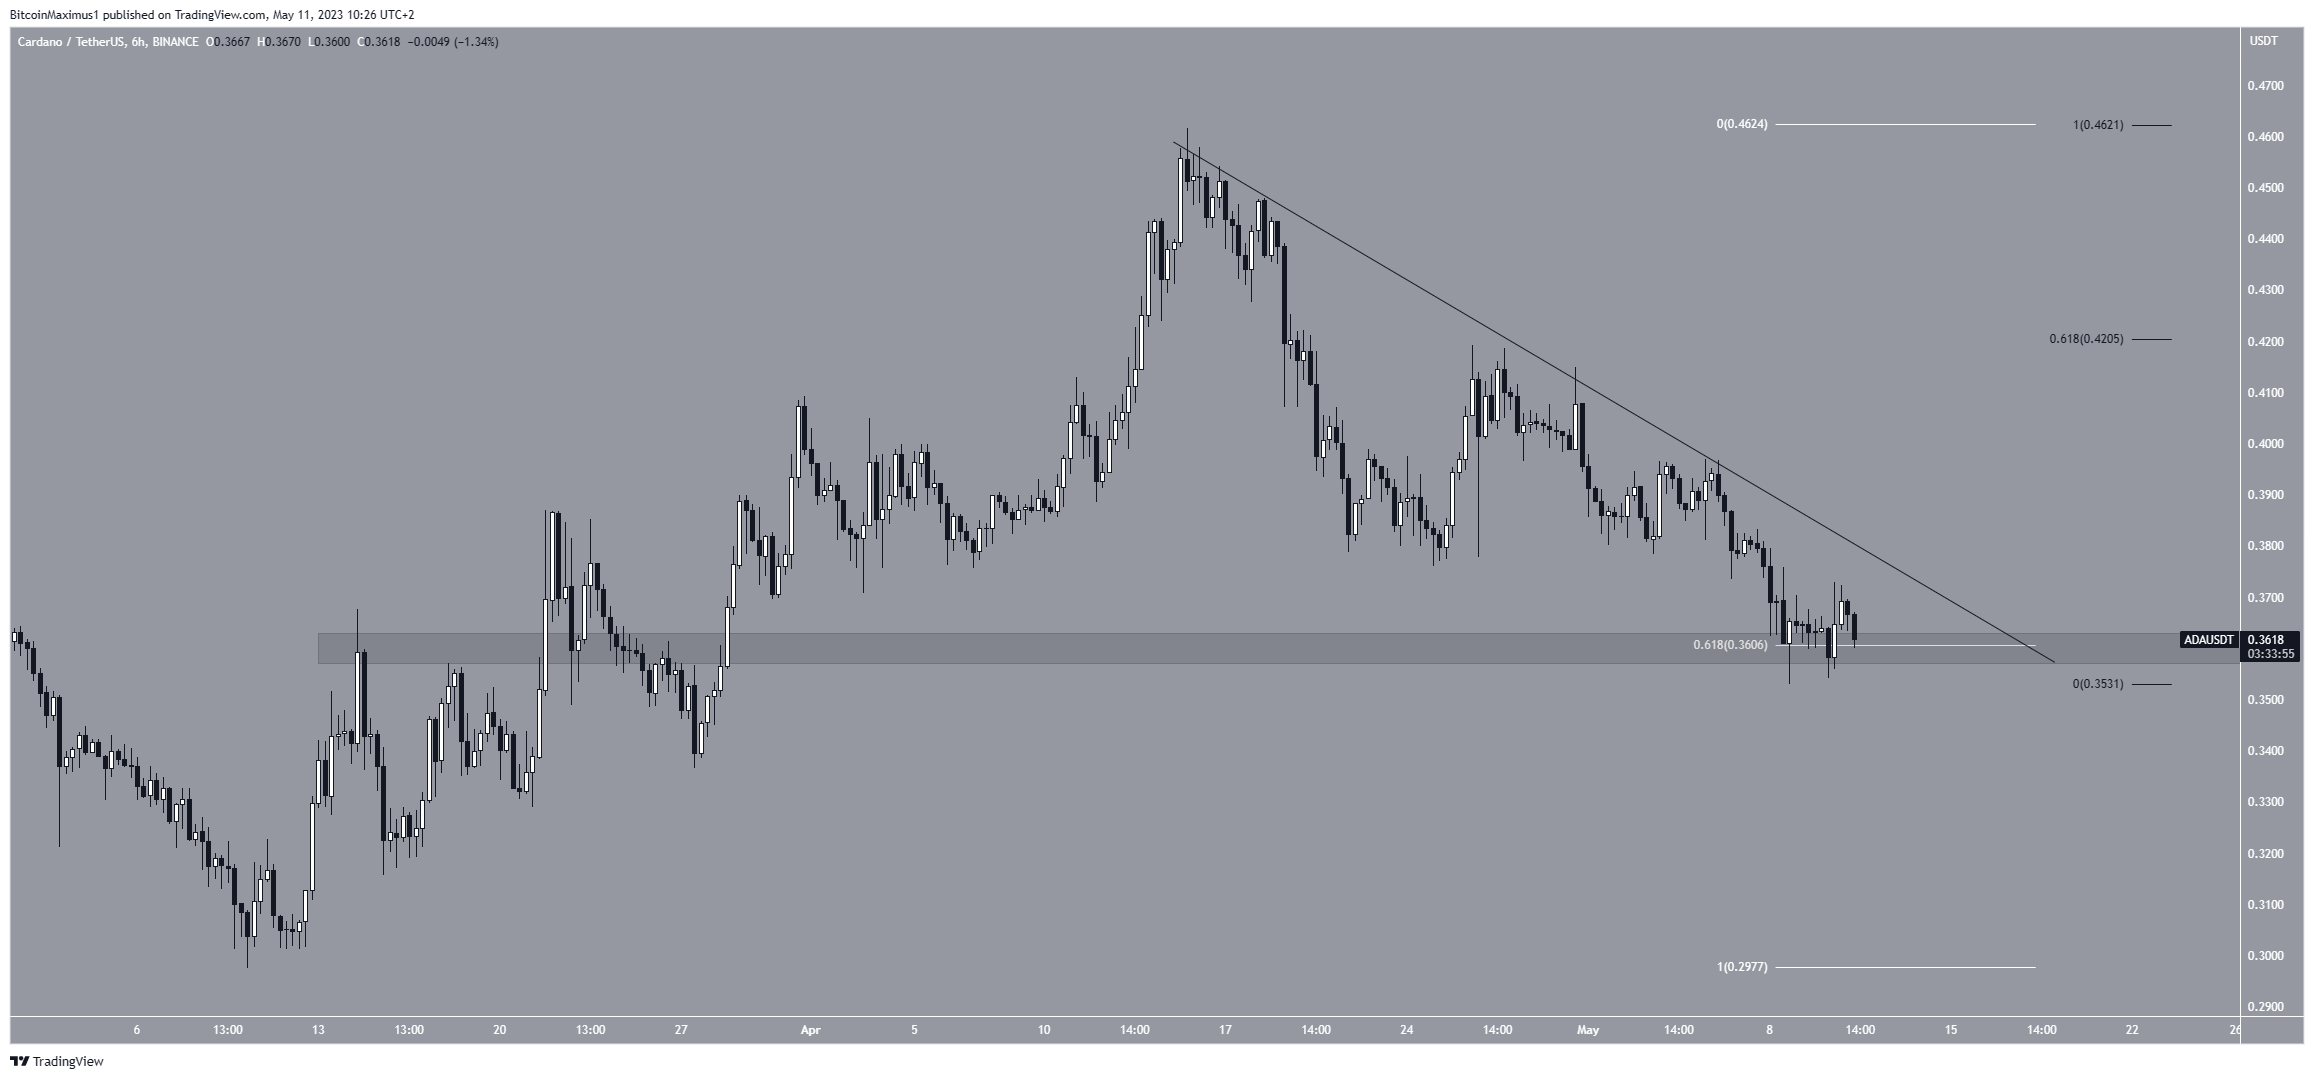
Due to the above, if the ADA price breaks down from the $0.36 horizontal support area, it could fall to the daily time frame support at $0.33 and possibly even go to $0.30.
However, if a breakout from the short-term line transpires, an increase toward $0.42 will be on the cards.
For BeInCrypto’s latest crypto market analysis, click here.
Disclaimer
In line with the Trust Project guidelines, this price analysis article is for informational purposes only and should not be considered financial or investment advice. BeInCrypto is committed to accurate, unbiased reporting, but market conditions are subject to change without notice. Always conduct your own research and consult with a professional before making any financial decisions.