BTC/USD Faces Fresh Support Below $22,500
Join Our Telegram channel to stay up to date on breaking news coverage
The Bitcoin price prediction shows BTC sliding towards the downside as the cryptocurrency could create another low at $22,000.
Bitcoin Prediction Statistics Data:
Bitcoin price now – $22,495
Bitcoin market cap – $432.8 billion
Bitcoin circulating supply – 19.2 million
Bitcoin total supply – 19.2 million
Bitcoin Coinmarketcap ranking – #1
BTC/USD Long-term Trend: Ranging (Daily Chart)
Key levels:

Resistance Levels: $27,000, $28,000, $29,000
Support Levels: $19,000, $18,000, $17,000
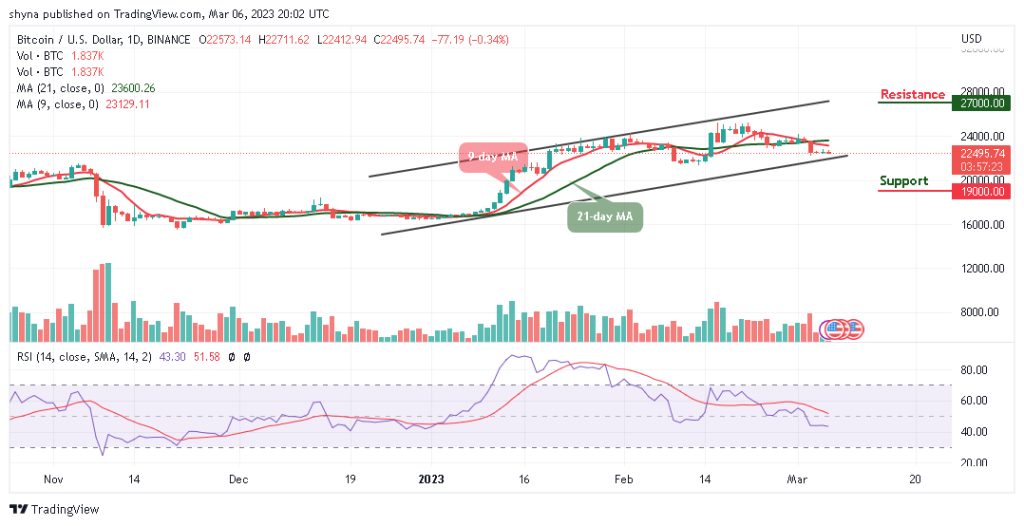
BTC/USD is dropping with another loss of 0.34% today as the crypto moves to cross below the lower boundary of the channel to reach the nearest support at $22,300. However, the daily chart reveals that $22,000 is a very important level for the king coin as it is expected to provide strong support for the coin.
Bitcoin Price Prediction: Bitcoin Price May Cross Below $22k
The Bitcoin price begins to slide below the 9-day and 21-day moving averages at support provided by the trend line. A breakdown to the downside could cause the Bitcoin price to create a new low below the $22,000 level. The king coin is currently in a critical position with the next few days dictating the direction that it will head. A drop below the lower boundary of the channel could be detrimental to Bitcoin as it could lead the coin back to the previous supports at $19,000, $18,000, and $17,000.
Meanwhile, if the buyers can rebound from the current level of $22,495, the first level of resistance could lie at $23,000. Above this, further resistance is expected at $24,000. This may likely follow by the potential resistance levels at $27,000, $28,000, and $29,000. Presently, the Relative Strength Index (14) is moving sideways below the 50-level, suggesting that the king coin may consolidate a little before heading to the south.
BTC/USD Medium-term Trend: Ranging (4H Chart)
According to the 4-hour chart, the Bitcoin price is seen hovering at $22,797 as the coin prepares to cross above the 9-day and 21-day moving averages. However, if the bulls push the market price above the upper boundary of the channel, the coin may likely hit the resistance at $24,000 and above.
Nevertheless, it now appears that the cryptocurrency is at risk of seeing further downside as the multiple attempts to shatter its $22,000 support seem to indicate that bears are building momentum. As the Relative Strength Index (14) prepares for more downside, the king coin may locate critical support at $21,000 and below.
Bitcoin Alternatives
At the time of writing, the Bitcoin price continues to range on the long-term outlook. The king coin keeps hovering around the $22,400 price level consolidating. There was no significant momentum in the market as both the bears and the bulls lost momentum and the price remains at the same level. The price is enclosed within the channel. Meanwhile, one key factor to consider is the progress of the FGHT token and the adoption of the platform. If the project can achieve its milestones and attract a significant user base, it could drive the demand for FGHT and potentially increase the price as almost $5.5m has been made so far in the presale.
Fight Out (FGHT) – Move to Earn in the Metaverse

CertiK audited & CoinSniper KYC Verified
Early Stage Presale Live Now
Earn Free Crypto & Meet Fitness Goals
LBank Labs Project
Partnered with Transak, Block Media
Staking Rewards & Bonuses
Join Our Telegram channel to stay up to date on breaking news coverage