Bitcoin Price Prediction: BTC/USD Stays Above $44,000

Bitcoin Price Prediction – August 8
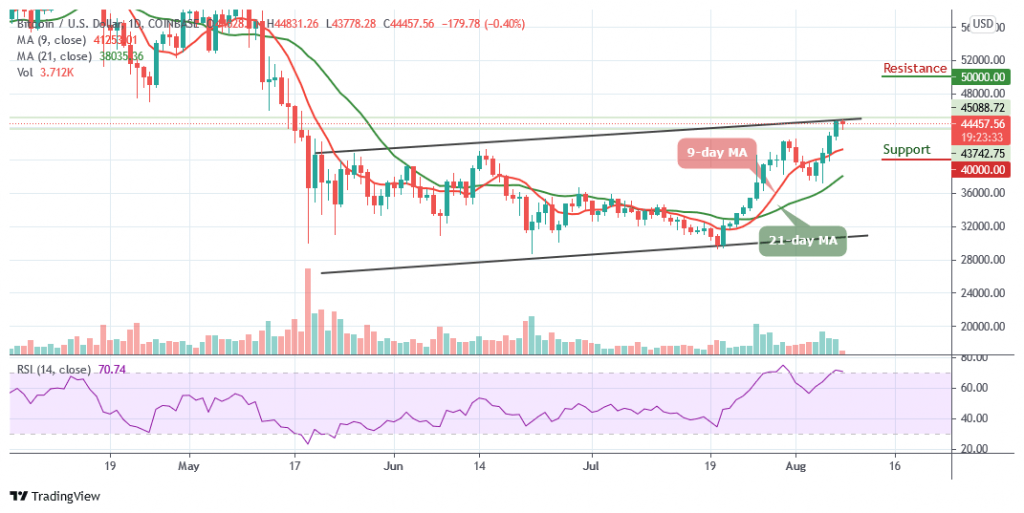
Looking at the daily chart, the Bitcoin price maintains above the resistance level of $44,000 as the price touches the daily low of $43,778.
BTC/USD Long-term Trend: Bullish (Daily Chart)
Key levels:
Resistance Levels: $50,000, $52,000, $54,000
Support Levels: $40,000, $38,000, $36,000
According to the daily chart, BTC/USD touches $44,831 as the monthly all-time high beckons. The king coin is seen trading well above the 9-day and 21-day moving averages at $44,457. However, the Bitcoin price is still within touching distance of forming a new all-time high above the previous high of $44,500, which is quite remarkable.
Bitcoin Price Prediction: Bitcoin Price May Record Another High
At the moment, the Bitcoin price is trading comfortably within the channel as the price is preparing to launch an additional bullish signal. Looking at the daily chart, one could say that the long-term outlook favors the bulls if the Bitcoin price crosses above the upper boundary of the channel with eyes now set on the resistance levels of $50,000, $52,000, and $54,000 respectively.
However, if the market price continues to drop towards the 9-day moving average, it could touch the low of $43,500 support. Moreover, the coin can rely on the long-term support levels at $40,000, $38,000, and $36,000 as the technical indicator Relative Strength Index (14) prepares to leave the overbought region, which could cause the coin to drop lower.
BTC/USD Medium-term Trend: Bullish (4H Chart)
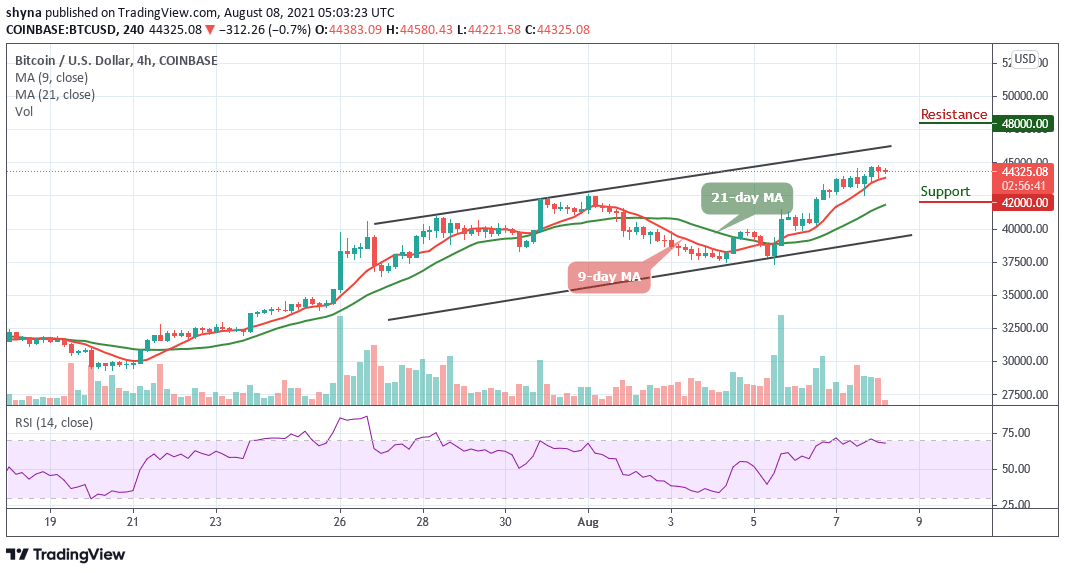
According to the 4-hour chart, the Bitcoin price is seen hovering above the 9-day and 21-day moving averages at $44,325. However, the king coin climbs above the long-awaited resistance level of $44,500 with a sharp upsurge before retreating to where it is currently trading. Nevertheless, BTC/USD may continue to maintain its bull-run towards the upper boundary of the channel as the technical indicator Relative Strength Index (14) stays around the overbought zone.

On the contrary, BTC may take a downward move if the bulls failed to push the price higher and it could probably breach below the 9-day moving average to reach the support level of $42,000 and below. Nevertheless, if the bulls find a decent resistance level above the upper boundary of the channel, the king coin may locate the resistance level of $48,000 and above.
Looking to buy or trade Bitcoin (BTC) now? Invest at eToro!
75% of retail investor accounts lose money when trading CFDs with this provider


