Binance Coin forms a descending triangle above important support area. 2023 gains are gone.

Binance Coin forms a descending triangle above important support area
2023 gains are gone
A break below $200 should trigger more weakness
The US dollar is the month’s winner as it rallied against its peers and against major cryptocurrencies in September. Moreover, the strength appears to be more visible against cryptocurrencies.
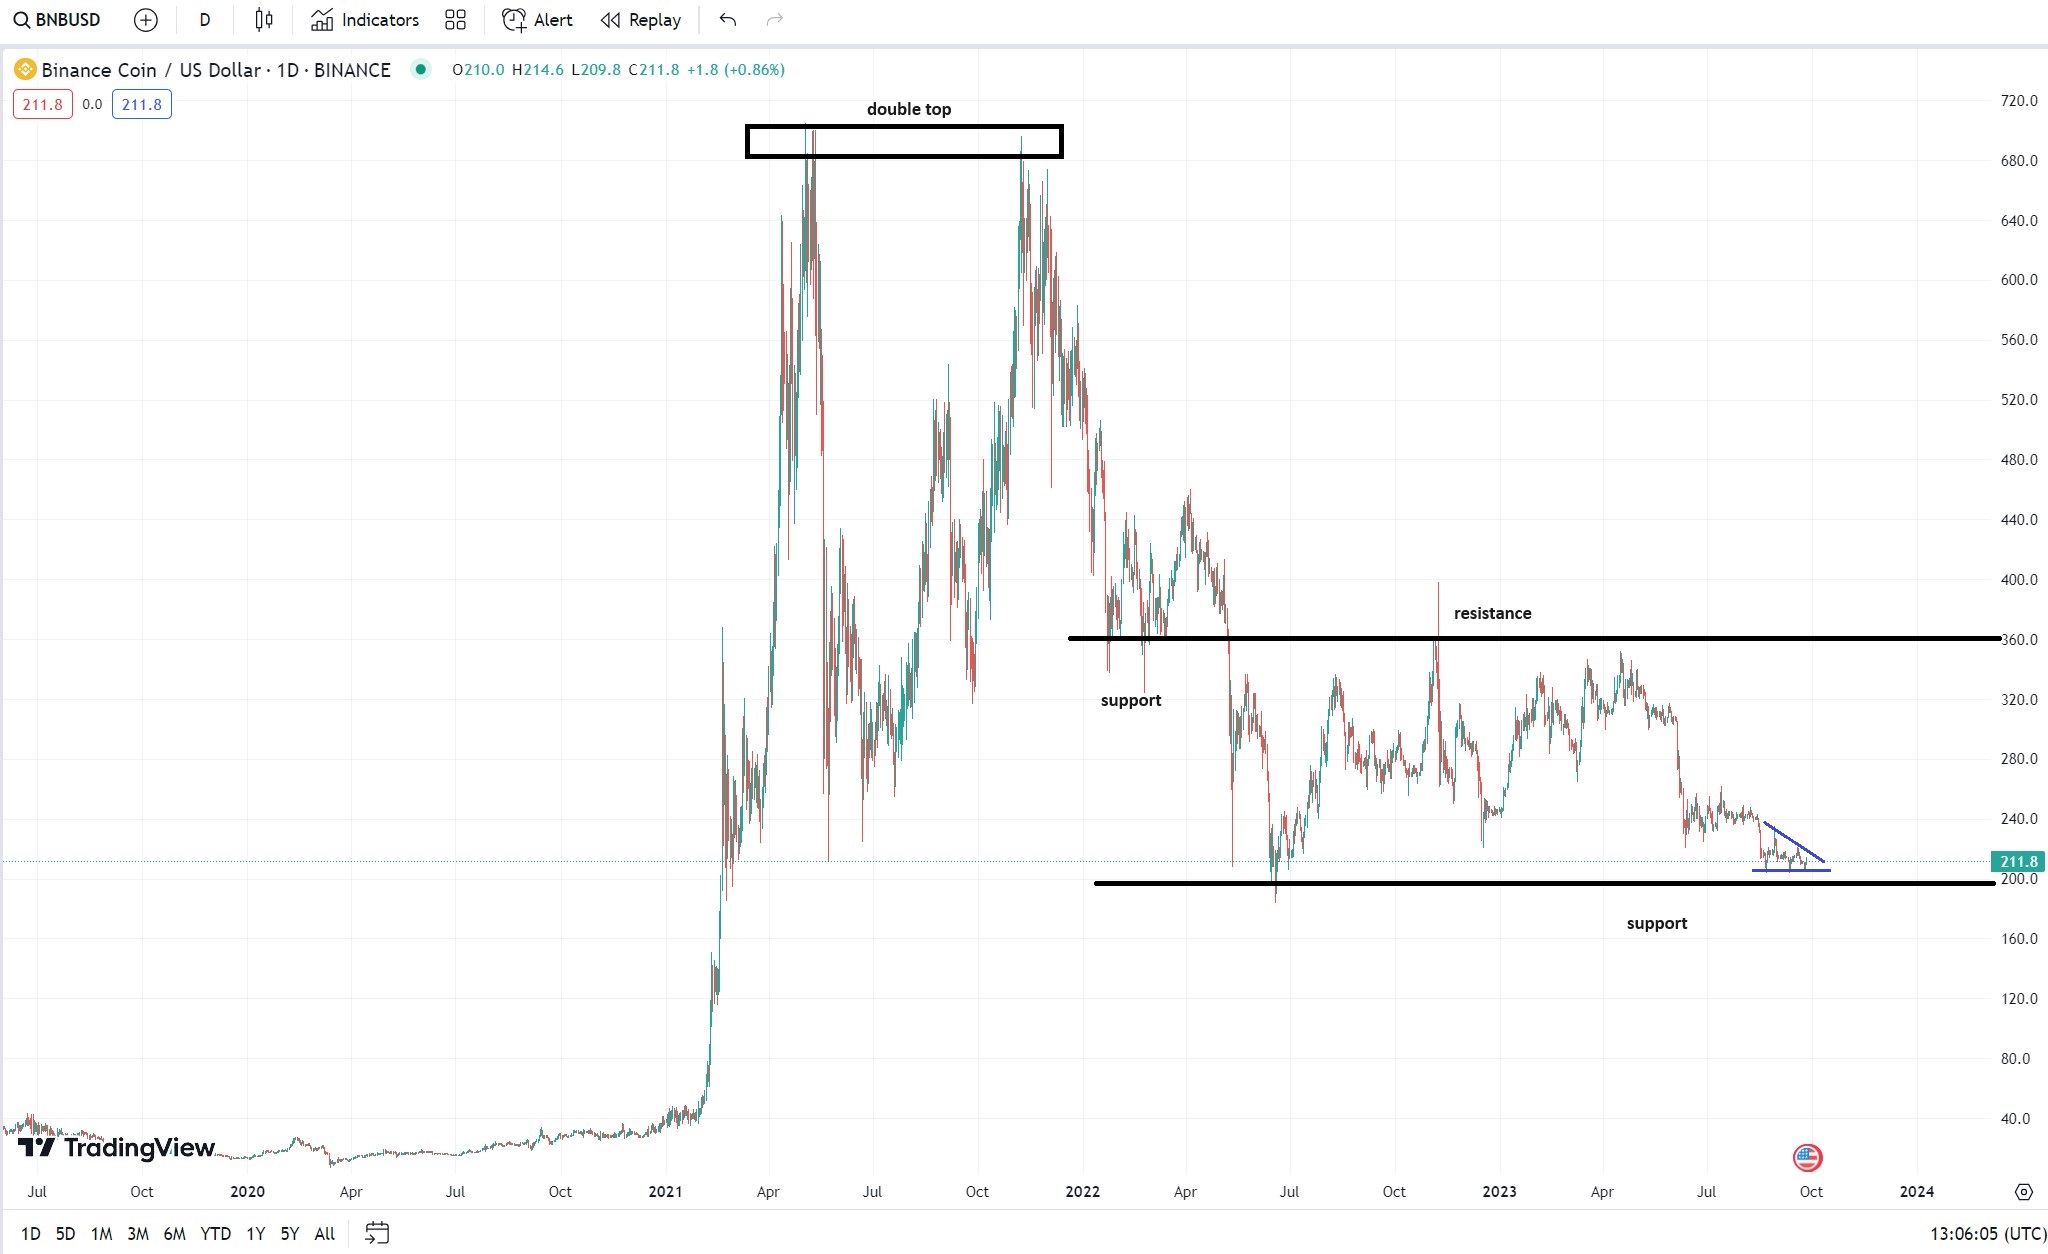
Take Binance Coin for example. It erased all its 2023 gains (and some more). It also formed a descending triangle right above horizontal support seen at $200. This is dangerous for bulls because, if broken, there is not much left to support the price until much lower.
Bearish technical picture for Binance Coin
Binance Coin made a double top pattern during the COVID-19 pandemic. Twice, it tried to break above $700, without success.
Since then, however, it was all downside. The scandals in the cryptocurrency industry surely did not help. After all, FTX went busted, trust was lost, and many chose to leave the industry altogether.

Binance Coin chart by TradingView
In the first quarter of 2022, the Binance Coin found support in the $350 area. It hovered above for a while until breaking lower to the next support level.
Once broken, support became resistance.
So powerful the resistance was that not even the 2023 rally, seen on all major currencies, was enough to break it. Instead, the market formed a reversal pattern (i.e., a triangle) and then erased all its gains for the year.
Currently, it sits right above horizontal support at $200. A break there could spell trouble because there is nothing else to hold the price action until much lower levels.
The US dollar’s strength is a cause of major disruption in the cryptocurrency industry. But so is the uncertainty in the industry, the ongoing scandals, that led to investors fleeing for good.
Bulls may want to see that descending triangle (in blue on the chart above) invalidated by the market. If not, more pain lies ahead.


