Solana Rallies Following 18-Hour Outage

Key Takeaways
Solana crashed due to a denial of service yesterday.
The network is now processing blocks, but some applications in the ecosystem have not yet recovered.
SOL could target $207.50 as optimism returns.
Share this article
The Solana Foundation reported a denial of service attack that took the blockchain down for 18 hours yesterday. Now that the network is back up, SOL appears to be making a recovery.
Solana Network Suffers Crash
The Solana network went offline for roughly 18 hours after experiencing “intermittent instability” Tuesday. The team behind the high-throughput blockchain reported that resource exhaustion had caused a denial of service.
It’s thought that the root cause of the issue was an IDO on the decentralized exchange Raydium. Bots tried to buy up tokens in the sale, flooding the network with 400,000 transactions per second.
Several queues in the validator code grew unbounded, and the lack of prioritization of network-critical messaging caused a chain split. The fork led to excessive memory consumption, leading validators to run out of memory and crash.
Solana Status, a Twitter account run by the Solana Foundation, reported that the issue had been ongoing for 45 minutes at 12:38 UTC, while the restart was completed at 06:01 UTC. Although the network is now up and running, some dApps, block explorers, and supporting systems have not yet recovered.
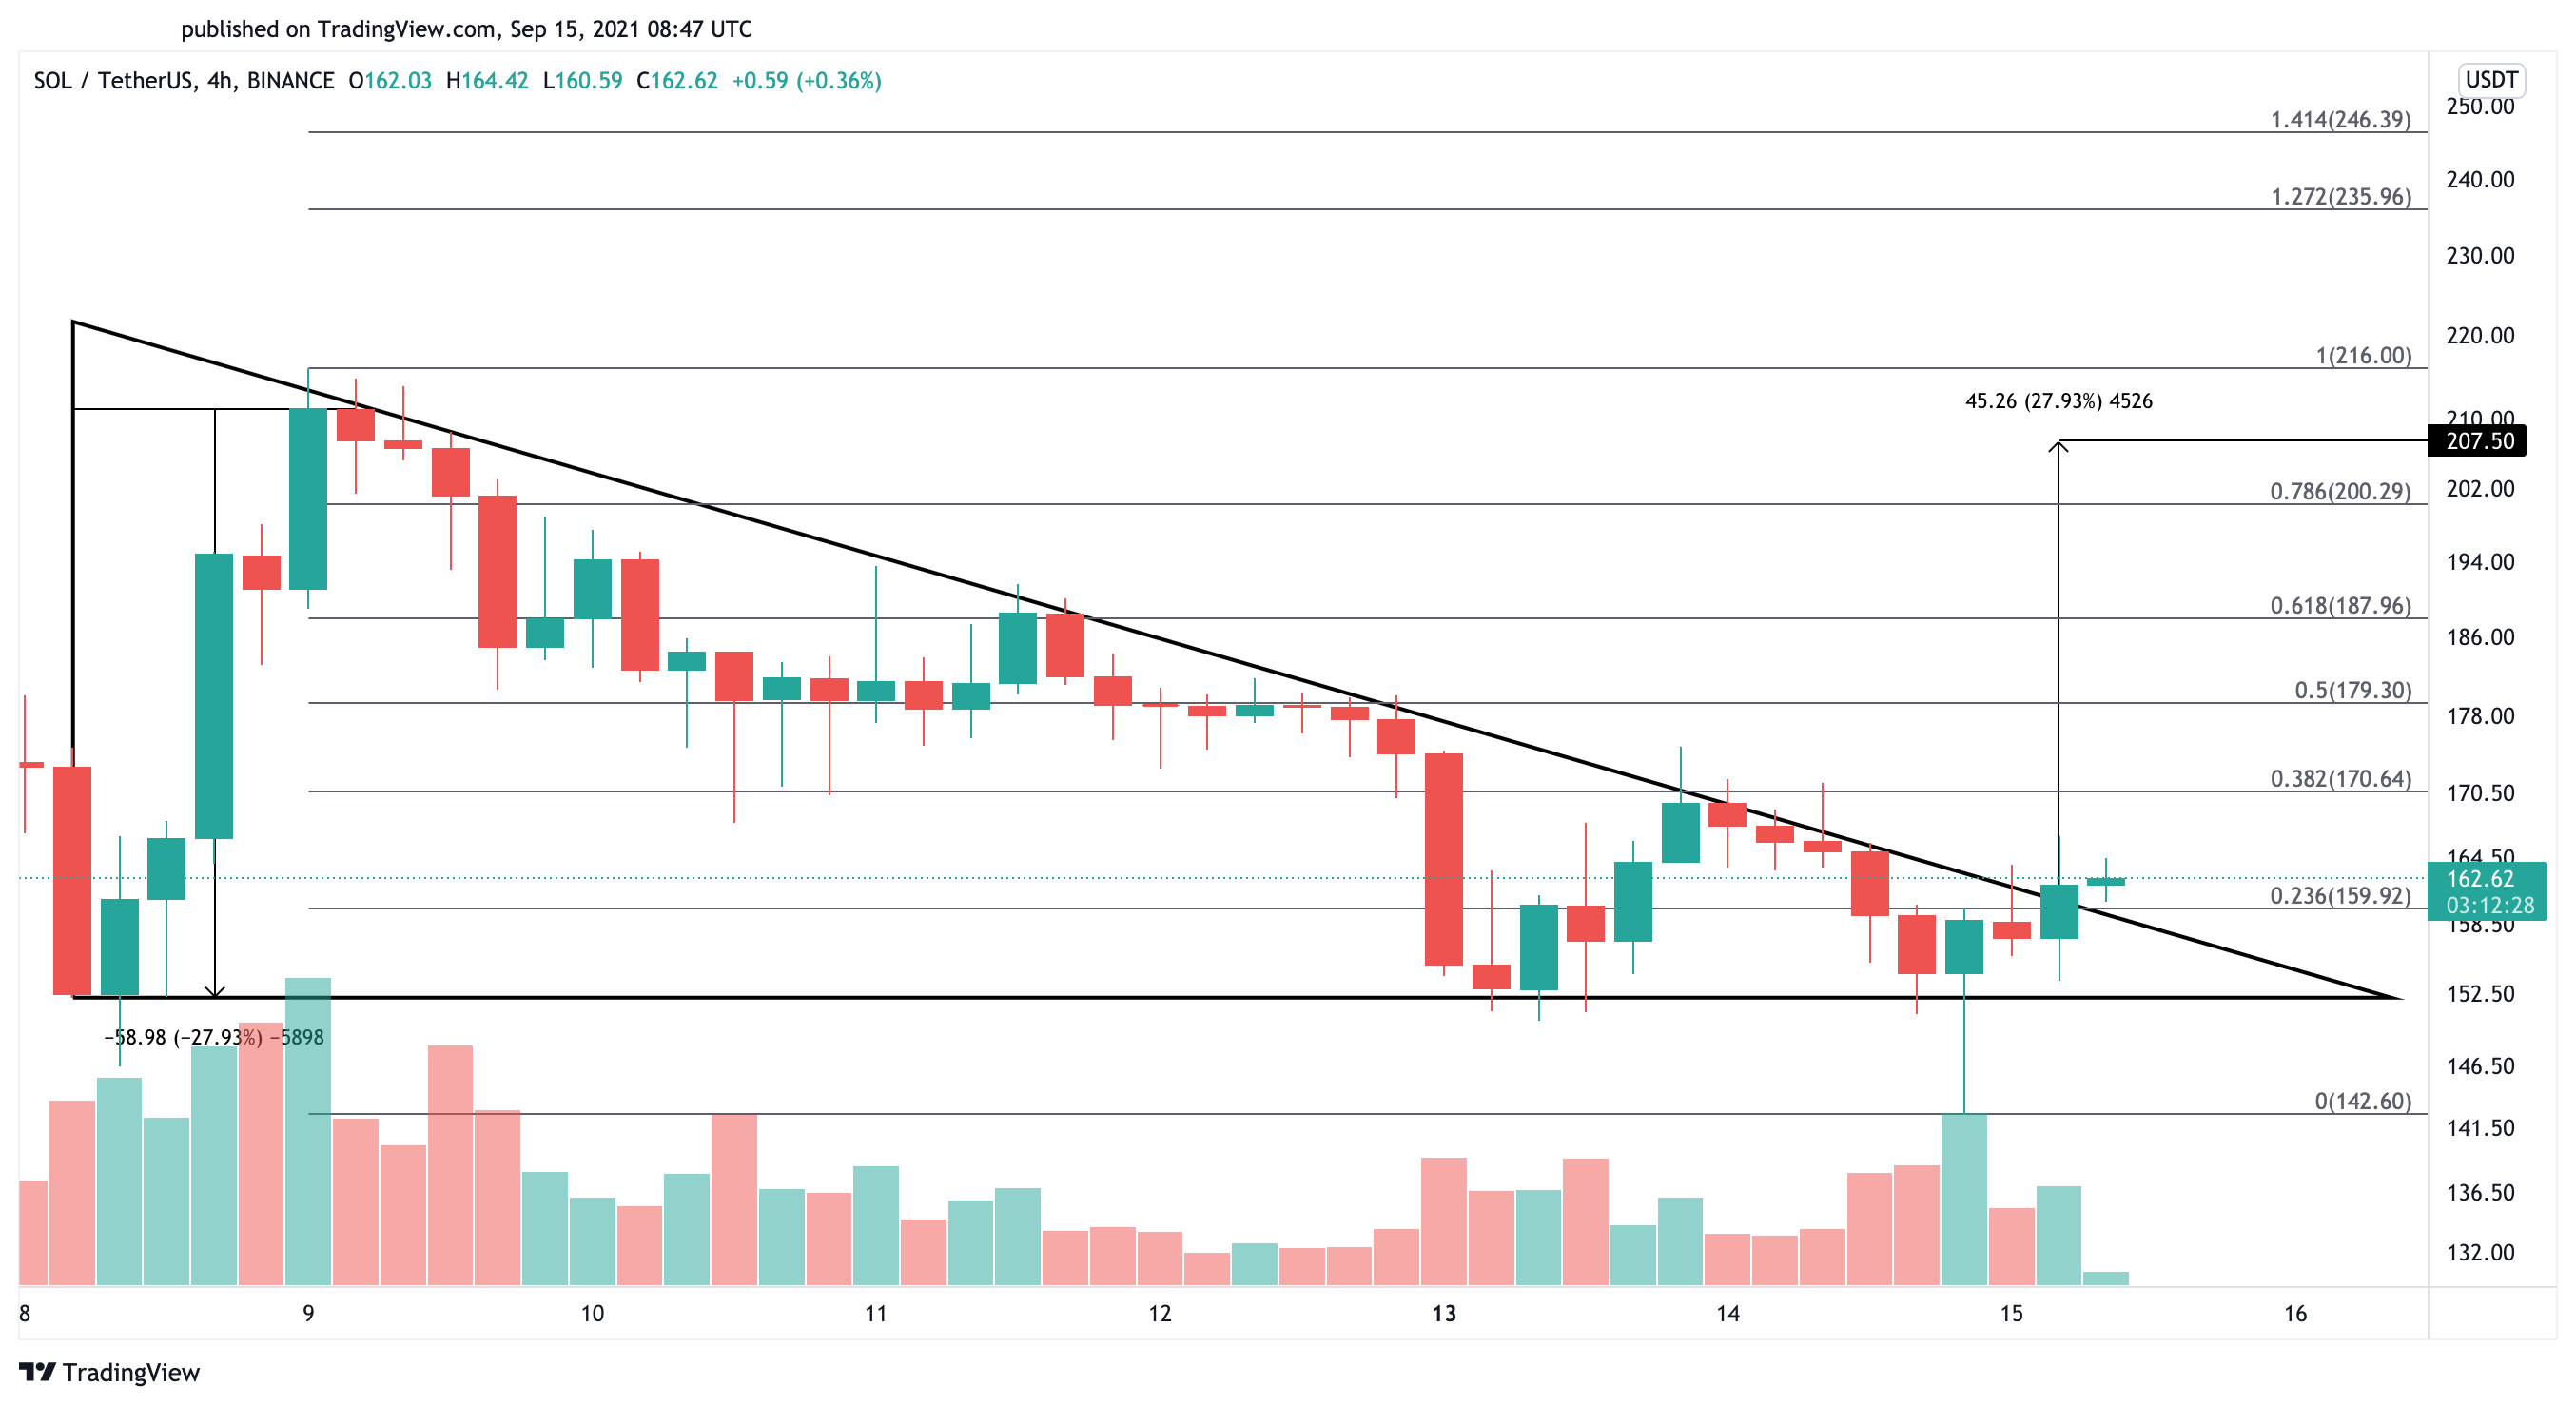
SOL, Solana’s native token, took a 17% nosedive following the network outage. The seventh-largest cryptocurrency by market cap briefly dipped from a high of $171.50 to a low of $142.60.
SOL Prepares to Rise
Despite the sudden price crash, SOL appears ready to resume its uptrend. It recently broke out of a descending triangle that had been containing its price action since Sep. 8.
Slicing through the 38.2% Fibonacci retracement level at $170.64 could serve as another confirmation factor for a 28% upswing toward $207.50.

It is essential to pay close attention to the 23.6% Fibonacci retracement level at $159.92. Given the increasing volatility, market makers could be setting up a bull trap to liquidate unaware investors.
A decisive four-hour candlestick close below this support level could put a hold on the bullish thesis and result in a pullback to the recent swing low of $142.60 or transform into a steeper decline to $110.
Share this article
The information on or accessed through this website is obtained from independent sources we believe to be accurate and reliable, but Decentral Media, Inc. makes no representation or warranty as to the timeliness, completeness, or accuracy of any information on or accessed through this website. Decentral Media, Inc. is not an investment advisor. We do not give personalized investment advice or other financial advice. The information on this website is subject to change without notice. Some or all of the information on this website may become outdated, or it may be or become incomplete or inaccurate. We may, but are not obligated to, update any outdated, incomplete, or inaccurate information.
You should never make an investment decision on an ICO, IEO, or other investment based on the information on this website, and you should never interpret or otherwise rely on any of the information on this website as investment advice. We strongly recommend that you consult a licensed investment advisor or other qualified financial professional if you are seeking investment advice on an ICO, IEO, or other investment. We do not accept compensation in any form for analyzing or reporting on any ICO, IEO, cryptocurrency, currency, tokenized sales, securities, or commodities.
See full terms and conditions.
Solana Hit By “Intermittent Instability” Again, Arbitrum Suffers O…
The Solana Foundation reported that the high-throughput blockchain was experiencing “intermittent instability” earlier today. Meanwhile, the Ethereum Layer Two solution Arbitrum also suffered an outage. Solana, Arbitrum Face Network Issues …
How to Trade Using the Inverse Head and Shoulders Pattern
In stock or cryptocurrency trading, you may have heard of the term “inverse head and shoulders.” Also known as the “head and shoulders bottom” formation, the inverse head and shoulders chart pattern can…
Solana, Fantom Recover From Dip to New All-Time Highs
Solana and Fantom have quickly recovered from the market’s recent flash crash. Both assets now sit at crucial support levels that could propel them into higher highs. Layer 1 Coins…
Solana Makes New All-Time High As Sell Signal Pops Up
Solana appears to be approaching exhaustion. A Wall Street-class trading indicator shows a one to four daily candlestick correction may occur before SOL advances further. Solana Flashes Sell Signal Solana…


