BTC/USD Slumps Below $45,000 Level

Bitcoin Price Prediction – August 18
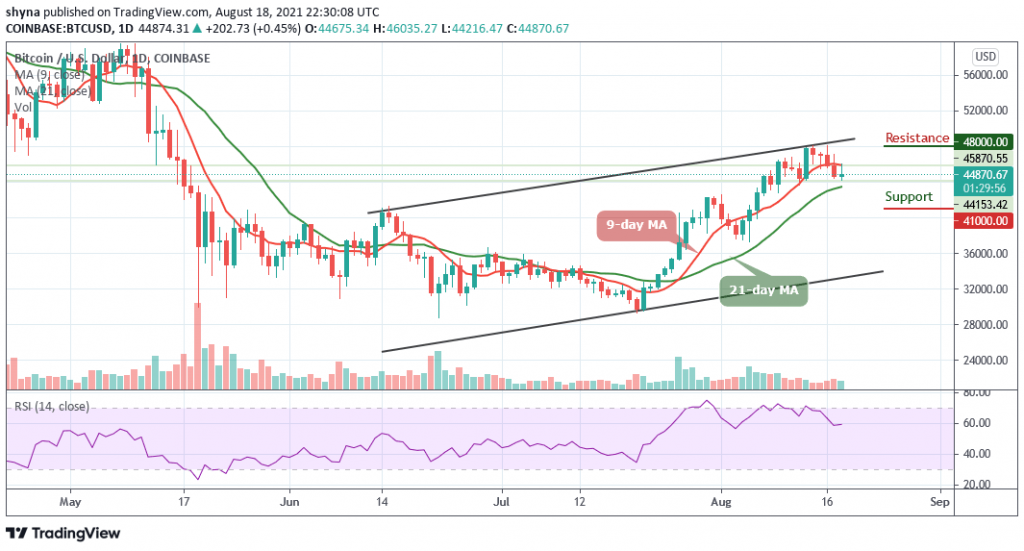
The Bitcoin price prediction shows that the BTC is currently hovering at $44,870, right below a crucial support level of $45,000.
BTC/USD Long-term Trend: Ranging (Daily Chart)
Key levels:
Resistance Levels: $48,000, $50,000 $52,000
Support Levels: $41,000, $39,000, $37,000
After touching the daily high of $46,035, BTC/USD is now attempting to rebound higher. Today, Bitcoin (BTC) managed to find support close to $44,000 and now making its way toward the $45,000 to reclaim the level. However, despite the recent declines in the market price, BTC/USD may follow sideways movement within the 9-day and 21-day moving averages.
Bitcoin Price Prediction: BTC Price May Cross Below $44,000 Support
At the time of writing, the Bitcoin price may continue to fall as the key support of $44,000 is becoming a threat to the bears. Meanwhile, there are quite a number of technical levels that are existing above the current price which means that BTC/USD may be vulnerable to further losses at least as long as it stays near the critical support level of $44,500. More so, BTC/USD may drop to $41,000, $39,000, and $37,000 supports if the $42,000 support failed to hold.
Therefore, in the opposite direction, if the critical support of $44,000 begins to provide support for the market, the Bitcoin price may come back to a resistance level of $46,000 before experiencing a rise above the 9-day moving average and the channel formation to reach the potential resistance levels at $48,000, $50,000, and $52,000 respectively. Presently, BTC is moving sideways and there is a high chance for a break than a bounce. The Relative Strength Index (14) is likely to cross below 60-level as a further drop may cause the Bitcoin price to fall more.
BTC/USD Medium-Term Trend: Ranging (4H Chart)
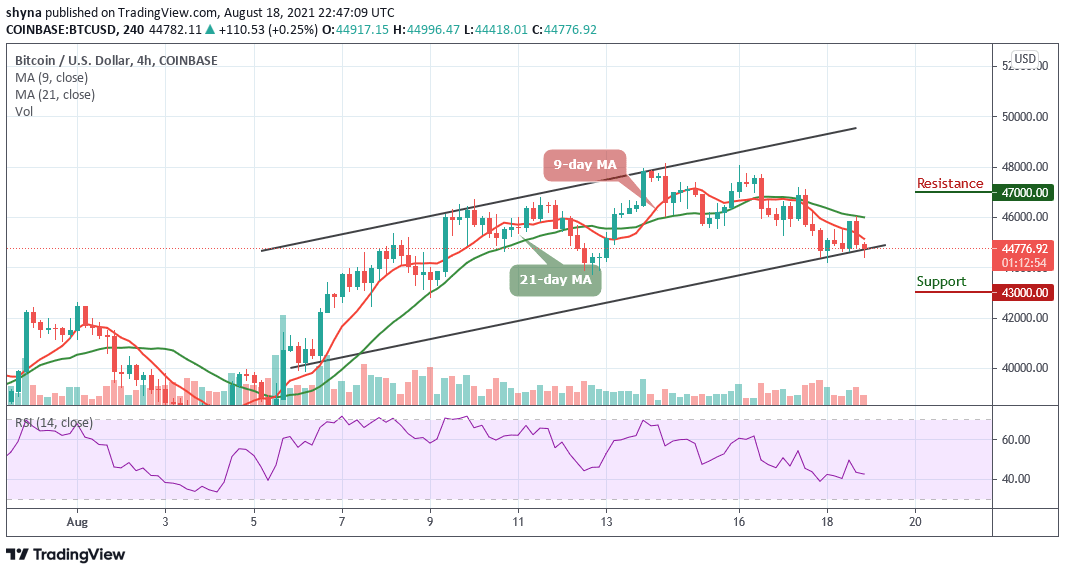
According to the 4-hour chart, the bears are currently dominating the market as the Bitcoin price is dropping below the lower boundary of the channel heading towards the south. However, if the price stays below the lower boundary of the channel, the support levels of $43,000 and below may come into play.

However, as Relative Strength Index (14) moves below 45-level, BTC/USD may remain at the downside but if it finds its way back to the top, the buyers could have gathered enough momentum to fuel the market and they may likely push the price above the 9-day and 21-day moving averages where it could hit the targeted resistance level of $47,000 and above.
Looking to buy or trade Bitcoin (BTC) now? Invest at eToro!
75% of retail investor accounts lose money when trading CFDs with this provider


