3 Bullish Altcoins Predicted to Outshine Bitcoin (BTC) in May

Bitcoin (BTC) is the biggest cryptocurrency in the world, but at times, even altcoins can surpass the performance of the king coin.
BeInCrypto analyses which three such altcoins hold the potential to outperform BTC in the month of May.
Binance Coin (BNB) Is Still in the Competition
Binance Coin price has been in consolidation for over a month and a half, attempting to close above $640. However, the altcoin has failed to do so, leaving it stuck trading around the $560 to $620 range.
However, BNB has the benefit of support from its investors and bullish market cues. The exchange native token is less than 16% from its all-time high of $686. Breaching it would enable Binance Coin to note further rise.
Read More: Binance Coin (BNB) Price Prediction 2024/2025/2030
Nevertheless, consistent consolidation is also possible and could extend the wait for a new ATH.
PEPE Won’t Stop
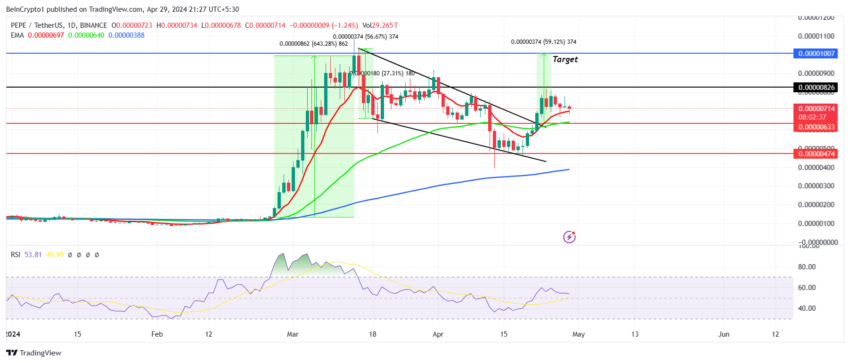
Despite facing tough competition from dogwifhat (WIF), Pepe (PEPE) has surprised the market with its recent rally. In the past three months, the frog-themed meme coin has witnessed a 586% growth.

Read More: Pepe (PEPE) Price Prediction 2024/2025/2030
If the meme coin stays above the 50-day Exponential Moving Average (EMA), it could reclaim $0.00001000 as support.
Tron (TRX) Takes It Back
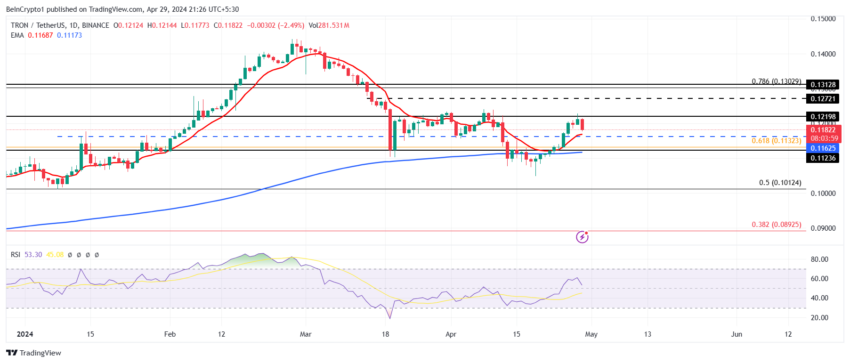
Tron’s price bounced back from the lows of $0.109, nearly avoiding the formation of a death cross. This bearish phenomenon occurs when the 200-day EMA crosses over the 50-day EMA. However, a sudden surge in Tron price resulted in the aversion of this death cross.
This has opened TRX up to the potential of a rally since the Relative Strength Index (RSI) is in the bullish zone.

The Relative Strength Index (RSI) is a momentum oscillator that measures the speed and change of price movements, indicating overbought or oversold conditions. It ranges from 0 to 100 and is typically used to identify potential trend reversals.
Read More: TRON (TRX) Price Prediction 2024/2025/2030
Should the RSI maintain the 50.0 neutral line as support, TRX could continue its rally.
Disclaimer
In line with the Trust Project guidelines, this price analysis article is for informational purposes only and should not be considered financial or investment advice. BeInCrypto is committed to accurate, unbiased reporting, but market conditions are subject to change without notice. Always conduct your own research and consult with a professional before making any financial decisions. Please note that our Terms and Conditions, Privacy Policy, and Disclaimers have been updated.


