How The Sandbox Shows That the Metaverse is Not Dead as SAND Surges 10% to $0.72
The Sandbox price is moving in tandem with the rest of the market against brewing negative sentiments regarding the state of metaverse and gaming crypto projects. Over the last 30 days, SAND’s value has increased by a whopping 50.5%, as investors bank on the bullish wave in the market to recoup a massive 91.8% correction from the all-time high of $8.40.
SAND price performance over the weekend was as expected – bullish, culminating in a 10% increase to trade at $0.72 at the time of writing. The bullish outlook in The Sandbox price has the potential to reach $1.50 in the coming days, but first, bulls must clear resistance at $0.75.
The Sandbox Price Flips Green Amidst Build Up to Game Maker 0.8
The bullish outlook in The Sandbox price can be partly attributed to the recently announced version of the Game Maker, a platform that allows users “to design, test and share experiences, such as games” in the ecosystem.
Users are looking forward to version 0.8 of the Game Maker, which will launch with “new multiplayer gameplay, lighting and visual effects features, video and audio streaming, equipment and wearables in social hubs,” the development team said.
“Players will be able to compete with each other, survive together and interact in brand new ways. From multiplayer races to parkour and obstacle courses, creators will have a chance to offer action-packed experiences to their players,” the team explained via a Twitter thread.
The Sandbox hopes to remain competitive in the metaverse and play-to-earn (P2E) arena with the release of “new lighting and visual effects, allowing for more immersive experiences.” With this, The Sandbox will move closer to “making the metaverse a destination to network and socialize with people from all over the world.”
The Sandbox Price Uptrend Could Hit Pause Ahead of Another Rally
The daily time frame chart shines a light on an intensifying seller congestion below $0.75 and highlighted by the falling trend line (dotted). It is essential for SAND to collect enough liquidity before attempting another breakout targeting highs above $1.00. Remember, there will be more hurdles as exhibited by the supply zone 1 (immediate gray band) and the supply zone 2 (upper gray band) around $1.50.
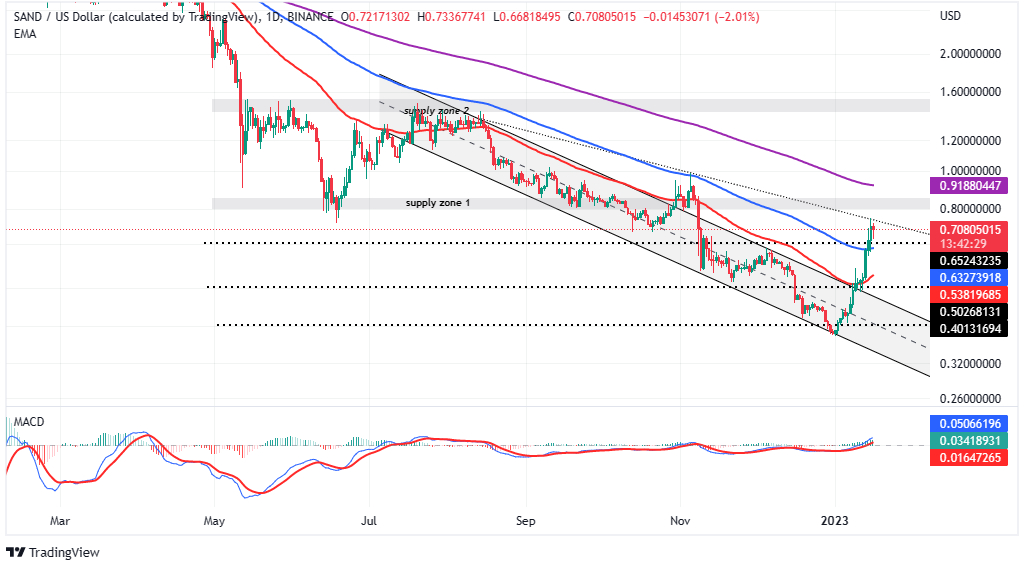
That said, the Moving Average Convergence Divergence (MACD) indicator cements the bulls’ growing position in the market. Notice the MACD (line in blue) above the signal line in addition to the entire momentum indicator holding above the mean line (0.00).
If the Sandbox price retraces, possibly due to some investors booking early profits, support provided by the 100-day Exponential Moving Average (EMA) (in blue) at $0.6324 will come in handy. The pullback could offer already sidelined investors a chance to get on the rocket before another lift off to $1.00 and $1.50, respectively.
In case sellers become more aggressive, The Sandbox price would be looking to the 50-day EMA (in red) at $0.5377 for support. A rebound from here or the falling trend channel could propel SAND substantially higher above $1.00.
Key Fundamentals Behind the Sandbox Price Rally
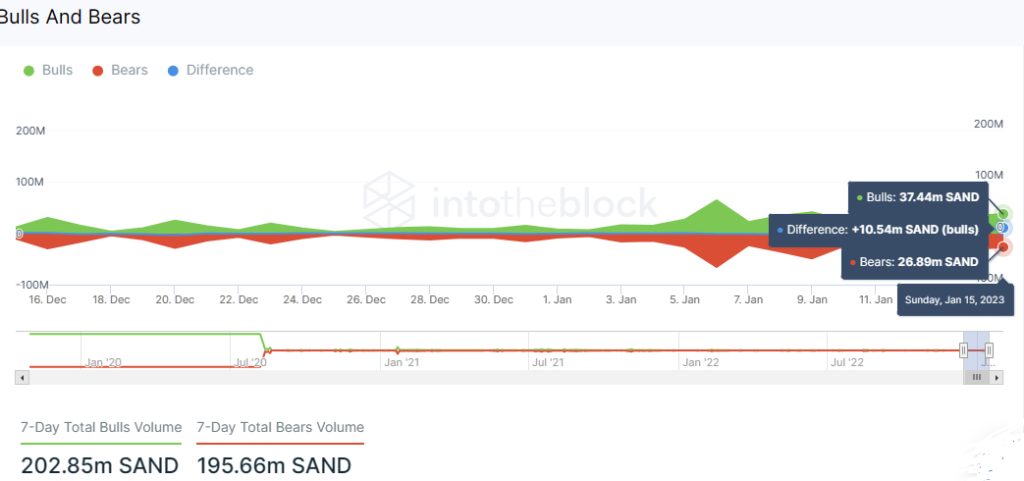
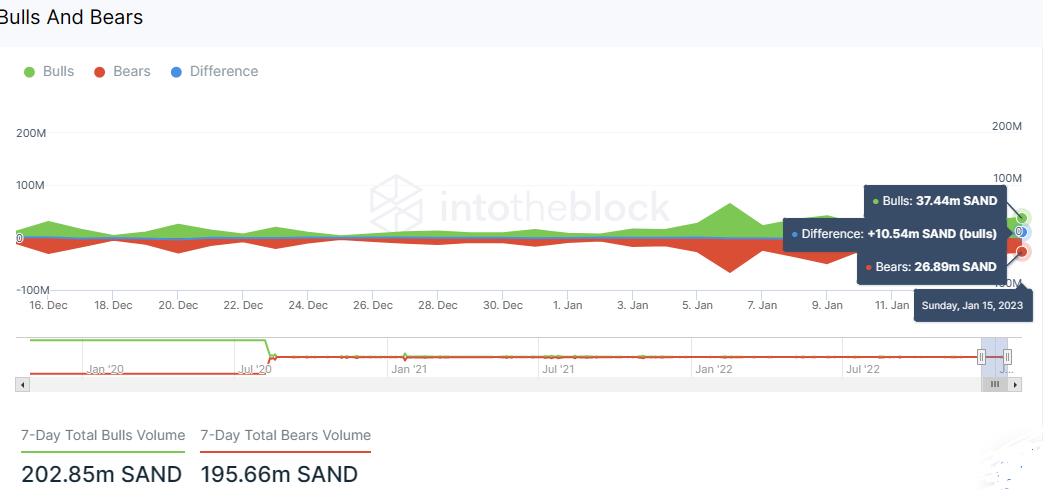
According to insights from blockchain data, as presented by IntoTheBlock, a leading on-chain analytics platform, bulls are more aggressive than bears. From the chart below, we can see the volume trendline slopping to the upside from the mean line.
The Sandbox price rally is supported by 37.44 million bulls compared to 26.89 million bears. This is a 10.54 million difference that is positively influencing SAND’s trend.
More on-chain data from IntoTheBlock shows that bulls hold the reins and that The Sandbox has a higher probability of extending the uptrend as opposed to slashing the gains made. Based on the IOMAP model, shown in the chart below, more investors are ready to back the rally above $1.00.
Approximately, 2,800 addresses previously purchased 49.44 million SAND tokens around $0.63 which coincides with the 100-day EMA support. In other words, if The Sandbox price retraces from $0.72, this immense buyer congestion zone would force a rebound, bolstered by an increase in the number of bulls.
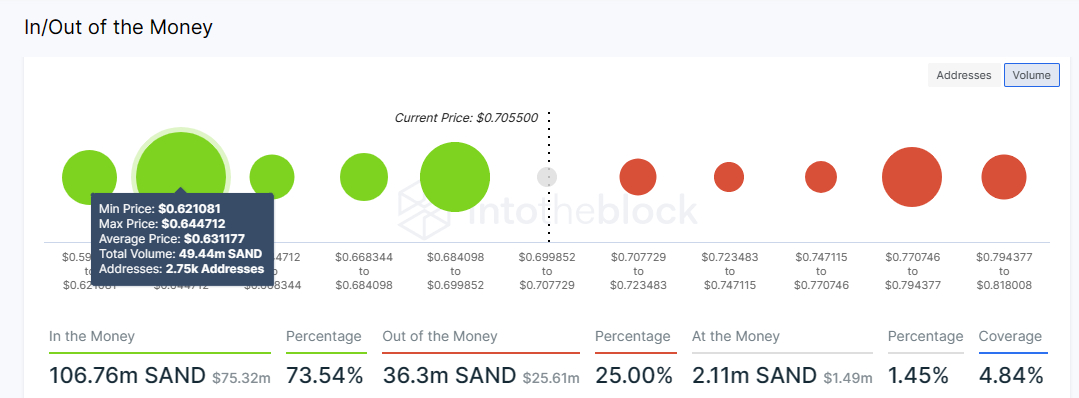
On the upside, The SAND faces relatively weak resistance levels with the strongest holding the ground at $0.7791, where 2,600 addresses bought 17.32 million tokens. The Sandbox price only needs a little push to climb through the waning seller congestion zones to $1.00 and $1.50, respectively.
Interested traders can buy The Sandbox and take advantage of the rally likely to reach $1.00 in a few days and $1.50 over the next few weeks. However, investors might want to look at Meta Masters Guild (MEMAG) for its better risk-reward potential. For more details on MEMAG, follow the link below.
New presale project: Meta Masters Guild – $MEMAG
Related Articles:


