
BTC/USD Stabilizes Above the $19,000 Level
Join Our Telegram channel to stay up to date on breaking news coverage
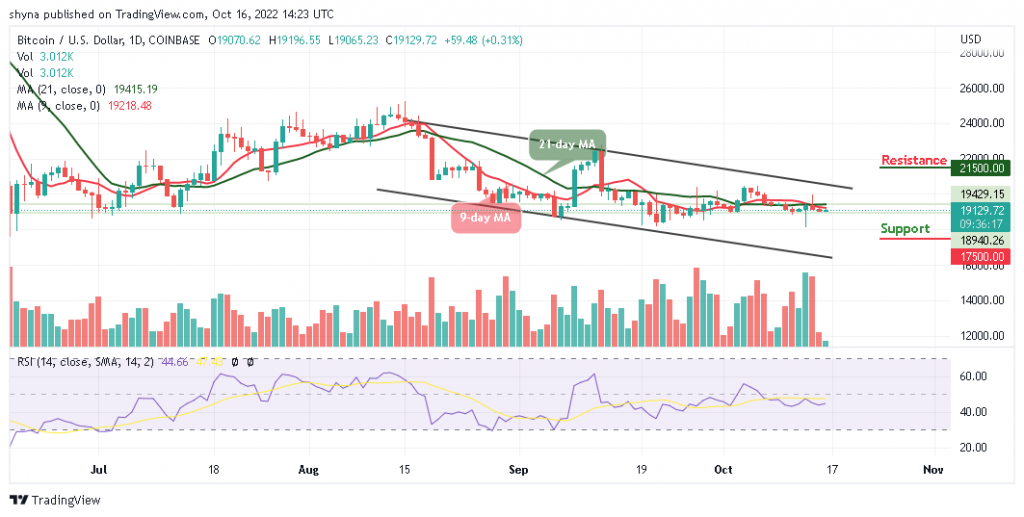
The Bitcoin price prediction shows that BTC is trading at $19,129.72 as the coin seems to be preparing for another upward movement.
Bitcoin Prediction Statistics Data:
Bitcoin price now – $19,129.72
Bitcoin market cap – $366.7 billion
Bitcoin circulating supply – 19.1 million
Bitcoin total supply – 19.1 million
Bitcoin Coinmarketcap ranking – #1
BTC/USD Long-term Trend: Ranging (Daily Chart)
Key levels:
Resistance Levels: $21,500, $23,500, $25,500
Support Levels: $17,500, $15,500, $13,500
Buy Bitcoin Now
Your capital is at risk
BTC/USD is likely to cross above the 9-day and 21-day moving averages at $19,129.72 as the coin prepares to follow the upward movement. At the time of writing, the king coin is likely to extend toward the resistance level of $20,000 if the bulls put in more effort.
Bitcoin Price Prediction: Bitcoin (BTC) May Hit $20k Resistance
The Bitcoin price is heading toward the upside, any further bullish movement above the 9-day and 21-day moving averages may locate the potential resistance levels at $21,500, $23,500, and $25,500. Normally, when new uptrends are coming up, the red line of the 9-day MA may need to cross above the green line of the 21-day MA. Nevertheless, if BTC/USD soars to the upper boundary of the channel, this could be a sign of sustainability and may likely result in a bullish continuation.
However, if the Bitcoin price fails to move up; traders may see a price cut towards the lower boundary of the channel, and a further low could bring the price to the support levels at $17,500, $15,500, and $13,500 respectively. But as it stands, the Bitcoin price is likely to rise as the technical indicator Relative Strength Index (14) moves to cross below the 50-level.
BTC/USD Medium-term Trend: Ranging (4H Chart)
According to the 4-day chart, the Bitcoin price is hovering below the 9-day and 21-day moving averages. However, suppose the bulls push the market above this barrier, traders may expect a retest of the $19,500 resistance level, breaking this level may further push the price towards the resistance level of $20,000 and above as the technical indicator Relative Strength Index (14) remains below the 50-level, which is suggesting a bearish signal.
However, if the bulls failed to push the market above the moving averages, traders may expect a retest of the $19,000 support level, and breaking below this level may further bring the price toward the critical support level of $18,500 and below.
Tamadoge – Play to Earn Meme Coin

Earn TAMA in Battles With Doge Pets
Maximum Supply of 2 Bn, Token Burn
Now Listed on OKX, Bitmart, LBank, MEXC, Uniswap
Ultra Rare NFTs on OpenSea
Join Our Telegram channel to stay up to date on breaking news coverage